
SUMMARY
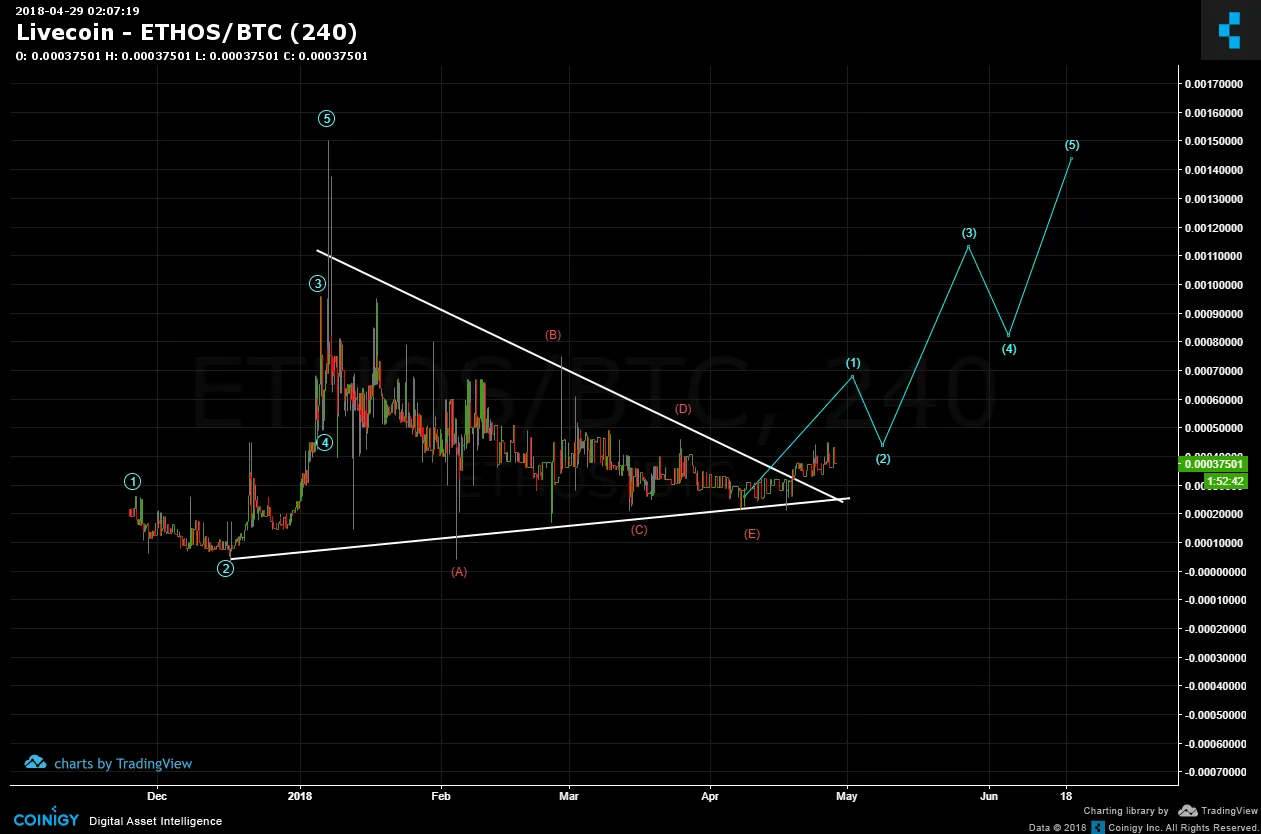
Back on April 18th; I had posted the below chart of ETHOS/BTC. The symmetrical triangle was pretty uncanny and price was very proximal to the apex. The MACD was also coiled to support a breakout and continued placement of the five wave impulse (white).

The current chart shows the breakout of price from the symmetrical triangle. I believe as long as Bitcoin itself holds up; ETHOS will start putting in higher highs. It needs to move in an impulsive manner and complete blue wave 1 at around 0.000675 BTC.
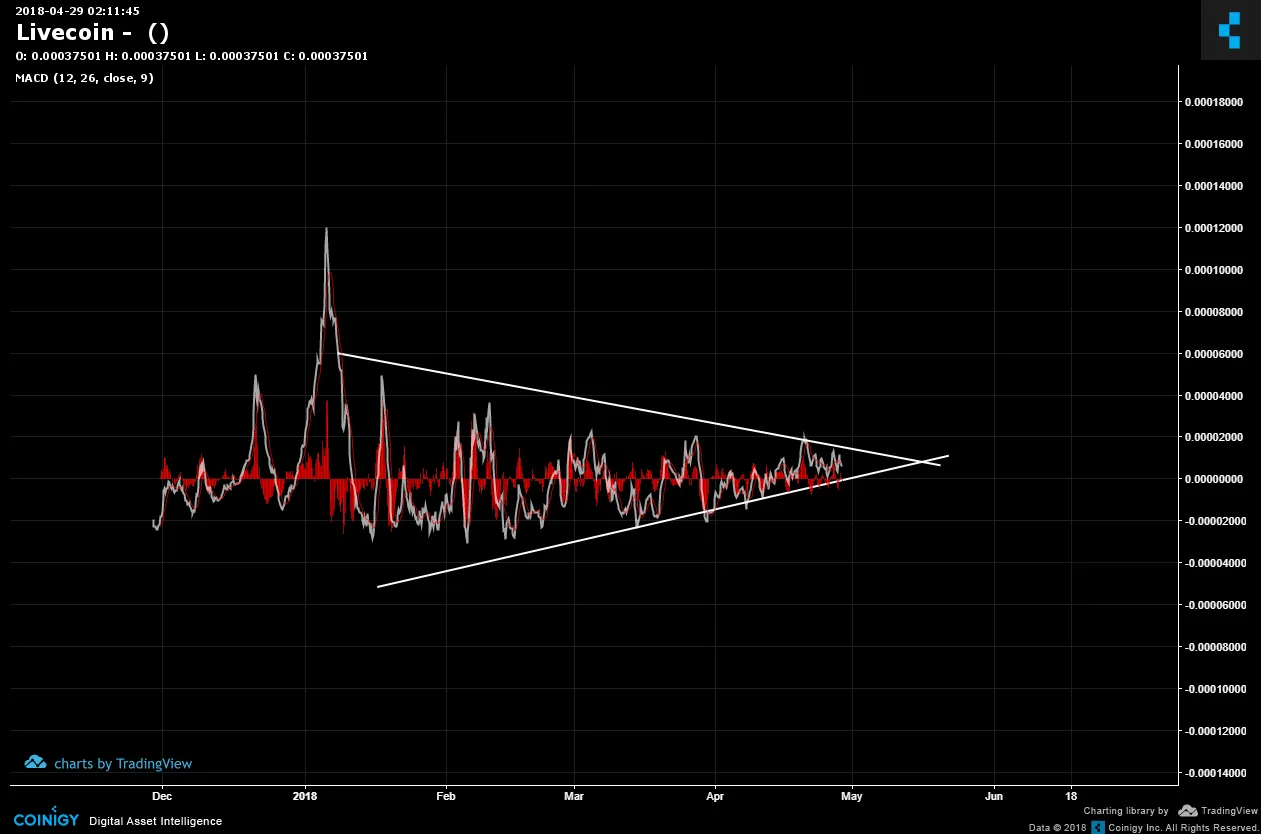
What's interesting is that the MACD has not yet broken out of its own symmetrical pattern. I believe it's only a matter of time before it does; and that's probably when ETHOS can display some surges in volume and price.
Legal Disclaimer: I am not a financial advisor nor is any content in this article presented as financial advice. The information provided in this blog post and any other posts that I make and any accompanying material is for informational purposes only. It should not be considered financial or investment advice of any kind. One should consult with a financial or investment professional to determine what may be best for your individual needs. Plain English: This is only my opinion, make of it what you wish. What does this mean? It means it's not advice nor recommendation to either buy or sell anything! It's only meant for use as informative or entertainment purposes.
Please consider reviewing these Tutorials on:
Elliott Wave Counting Tutorial #1
Elliott Wave Counting Tutorial #2
Elliott Wave Counting Tutorial #3
Laddering and Buy/Sell Setups.
Laddering Example with EOS
Tutorial on the use of Fibonacci & Elliott Waves
@haejin's Trading Nuggets
Essay: Is Technical Analysis a Quantum Event?
Follow me on Twitter for Real Time Alerts!!
Follow me on StockTwits for UpDates!!
--
--

