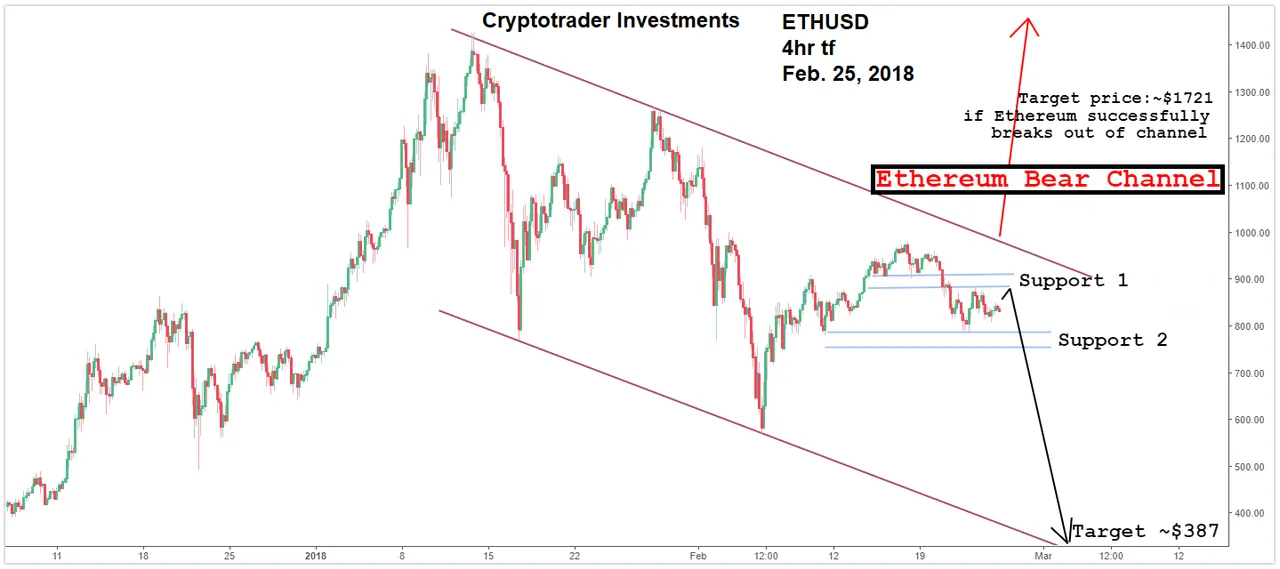
Price action in Ethereum appears to be trapped in a channel ever since it made its high of ~$1424.00 on Jan. 13,2018.
Ethereum bullish price swing from the bottom of the channel at ~$569.49 should have tested the top of the channel at ~$1027.01, but failed to do so. This is a sign of weakness by the bulls. Instead, Ethereum turned back down to break Support 1. The top range of Support 2 was successfully tested at ~ $786.82.
A break below the bottom range of Support 2 at ~ $756.01 will confirm further weakness and could trigger a sell off in Ethereum to about $387.
The bottom of the channel as drawn shows a maximum target for the sell off to be around $321. However, it is also possible to start to see profit taking into the last 10% or 20% of the bottom of a channel so it all depends on the risk/reward ratio that is being used in the trade.
The safest areas to buy Ethereum -0.93% that provide a great risk/reward ratio are :
(1) Going long ONLY after a clear breakout above the ~$977.43. A vertical projection of the width of the channel above the breakout point gives a price target of ~$1721.
(2) Wait to see if Support 2 is broken and to buy at the bottom 10% or 20% of the current channel. Somewhere in the low $330 and $360 should be monitored for possible areas to start to consider buying Ethereum -0.93% should it sell off.
Selling screnario
The best bearish scenario for now would be to see if Support 2 is broken. If it is, sell the break below the bottom range of Support 2 at ~$756.01 and a stop loss can be placed just above the top range of Support 2 at ~$786.82. Doing this would also easily give a risk/reward ratio of greater than 3:1
Disclaimer: The comments above and chart annotations are my own opinions and meant only for informational purposes ONLY. It is NOT a buy or sell recommendation