This content was deleted by the author. You can see it from Blockchain History logs.
EOS Launch Turns Into Total Clusterf**k - Bad Omen Or Prime Buying Opportunity?!
NOTE: For an update (play-forward) of this analysis, click on the Tradingview chart image above, then the triangular play button when you get to Tradingview. Enjoy and comment what you think!
Hola guys and gals, so I’ve been working on one of my favorite big movers (up & down) today. And yes, it did have some functionality & performances issues on its launch. Ah, but does that present us with an opportunity now? Let’s see if I can answer that question for you!
BOTTOM LINE:
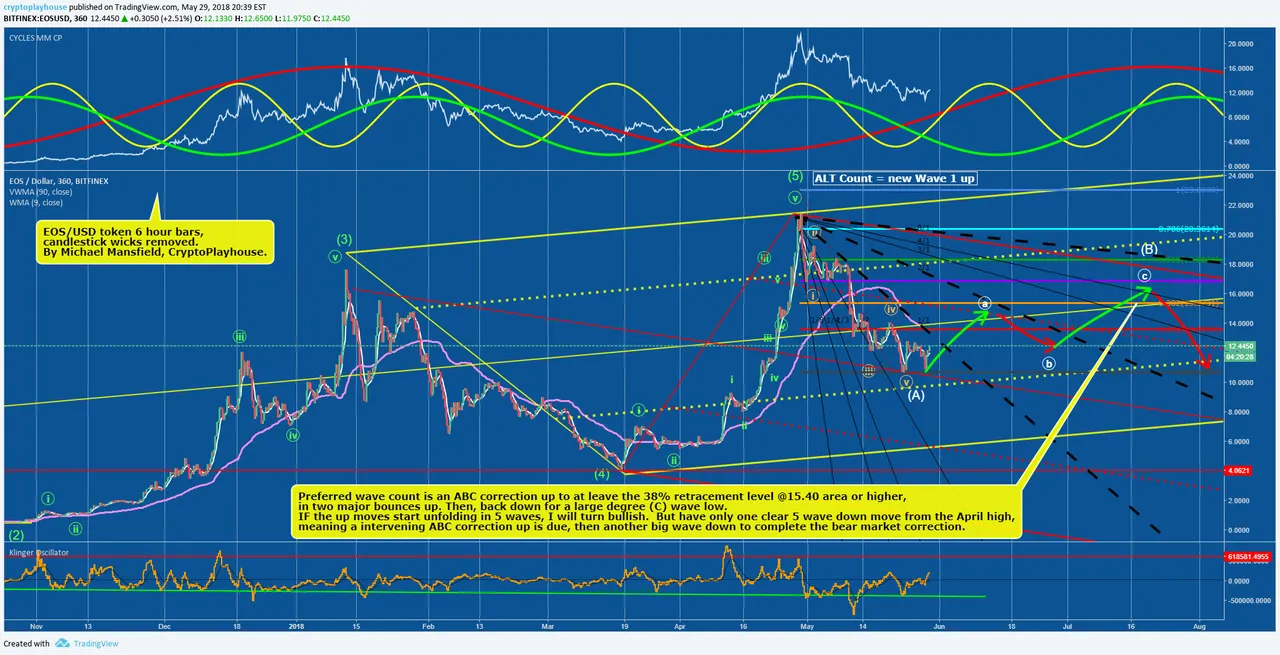
EOS/USD has had a clear 5 wave down move from the April 28th all-time high. That means an ABC bounce of 38% or more is likely now. Then another leg down for a larger degree Wave ( C ) lower to finish off the bear decline. The potential problem with this wave count is the longer-term cycle being strong bullish.
Regardless, it looks like the first higher swing low is now in place on this 6 hour chart. So some upward movement is likely either way you look at it.
CYCLES:
- Longer-term cycle (red) is up and in the middle of its move. We do not have enough data to determine if this cycle is fully accurate and in alignment with the genesis of EOS, so we are forced to extrapolate and have it synced only to two major prior visible highs.
- Medium-term cycle (green) is moving down since around the all-time high. It bottoms June 12-14th.
- Short-term cycle (yellow) is moving up since the May 23rd low and will likely help with this expected Wave (a) bounce.
ELLIOT WAVES:
- Preferred wave count: I’m looking at an ABC correction occurring over 3-6 months or so. We’ve had the large degree Wave (A) decline from the April 28th all-time high. Now we should see a large degree Wave (B) up to at leave the 38% retracement level @15.40 area, or higher, in two legs up, Wave (a) & (c). Then, another large degree (C) wave low is likely.
- Alternative Count: The move to an all-time high did have high momentum. And, Volume Force made a new all-time high while EOS was on the way up in April 2018. That said, should the expected up waves unfold in clear 5 wave impulse fashion, without overlapping waves, with strong volume in Wave 3, etc., then I will turn bullish fast.
- Regardless of count: I expect a tradeable bounce now. We currently have to go with the highest probability pattern based on the facts at hand, mentioned in the “Bottom Line” above.
- We'll likely know shortly if the bounce is a new bull market up or just a corrections.
INDICATORS:
- Klinger Volume Force indicator (orange, bottom window) is in the middle of its range and expected to continue higher now.
- Not reaching the upper threshold (red horizontal line) will be one of these clue I need to see to tell me that this bounce (or more) is just a correction, not a new bull markets.
- If indicator does tap the upper threshold, then I will likely have to rethink the wave count into a more bullish impulsive move up.
POTENTIAL TRADE:
- Short-term cyclical long trade. The lower risk area should be around now since it looks like the first higher swing low is now in place on this 6 hour chart.
- Or, wait for a 34-50 bar EMA average (or something better) turns up, with price is also closing above the average, then buy the first lowest low of the past 4 bars on a 4-6hr chart.
DISCLOSURE:
This analysis is meant for educational purposes only. You trade at your own risk!
Cheers!
Michael Mansfield CIO
Let me know what you think.
Comment Below!