We all like power, there's no surprises there I think; It allows us to do things more easily, efficiently and quickly and most of us who use it every day would be completely lost without it. That's why we're happy, no willing, to pay so much for it although, there are alternative sources, one such source I had installed to my home around October 2016, namely, solar collectors.
It's been a few years since that installation now and over that time I've kept track of the impact of my solar system which has been made easier by the interface that speaks directly to my system in live time and reports to my phone. Having said that, I don't look at it month to month as the power bill that comes in tells the real story.
We've saved over 75% of our pre-system power bill since installing the system and whilst it was an initial lump-sum outlay we had it paid off within two years, meaning we had recouped the cost of it in savings received.
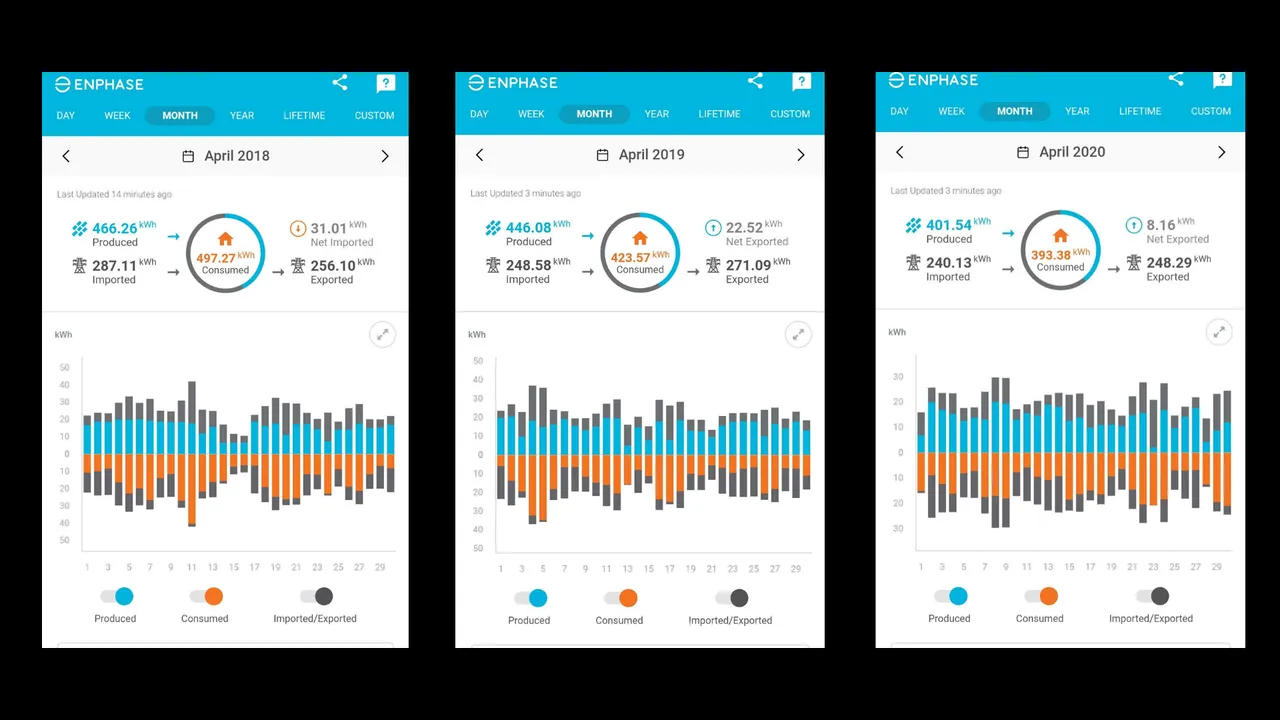
Anyway, I thought it would be interesting to see what April 2020 looked like in comparison to the last two years considering I have been working at home due to the flu situation. You can see below, three snapshots showing April in 2018, 2019 and 2020. I'm pretty happy with what I see.
Production
This is reasonably constant although we have had a 45kWh dip in energy production in April 2020. This is directly related to the number of sunny energy-producing hours in the month and indicates less sun in April 2020 than the last two years.
Imported
This is a more pleasing figure as the lower the better. This is power we have imported for use directly from the grid (and paid for.) You can see it is much less in 2020 which means we have paid for less power.
Exported
This figure is also important as we get paid for exporting power back to the grid. On those days when the household is using less power than we produce the power we collect feeds directly back to the grid paying us a dividend per kWh, funds which offset our power bill each quarter.
We had an upward trend going, including 2017 although this April with less sunlight we have dipped again.
Consumed
Here is where Faith and I can have a little impact upon the figures. With good power-usage behaviours we can reduce the amount of power we use day to day. You can see here that we have a strong downward trend which indicates our power-usage habits are improving. This relates directly to another metric below. It's clear to see a strong downward trend of consumed energy for the household with under 400kWh consumed in April 2020.
Net exported/imported
You will note 2018 shows a net import figure of 31.01kWh. But look at 2019 with 22.52kWh of net exported power! Of course, 2020, with less sunny days in April shows a decline but we know why. Still, we're exporting not importing as a net figure, so that's a benefit.
It's been very interesting to track our last four years of power usage and production and pleasing to see trends forming.
We are a little limited to what the weather does although in Australia we get plenty of sunshine. Different months have different production and usage figures of course. In summer we produce more, but use more to power the air conditioner for example. Overall though we are pretty happy with the figures.
Over the lifetime of the system, year by year, the figures are quite similar and where we have gained or lost performance can be tracked by drilling down into the reports which give us a better understanding of where we could improve.
Having the power to delve into one's power-usage habits allows room for change which relates to money saved and, in my opinion, that is a good thing. It helps the environment too I suppose right?
Design and create your ideal life, don't live it by default - Tomorrow isn't promised.
Be well
Discord: galenkp#9209