Generate a sine signal having frequency f = 5 Hz, and amplitude 1 Volt.
%frequency of single signal
Fs=100;
t=(1:100)/Fs;
f=5;
s=sin(2pif*t);
subplot(2,1,1)
plot(t,s)
xlabel('time')
Output

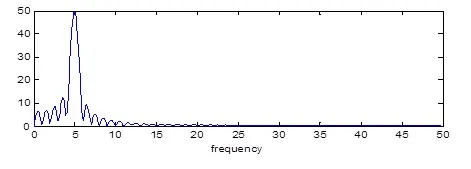
Utilizes the fft function to transform the signal into the frequency domain
%utilize the fft function
S=fft(s,512);
w=(0:255)/256*(Fs/2);
subplot(2,1,2)
plot(w,abs(S(1:256)))
xlabel('frequency')
Output