Most people that want to buy a house cannot afford to buy a house outright. Therefore, these people obtain a loan to afford to pay for the house. This type of loan is called a ‘mortgage’. The house bought is used as collateral to support the loan. In other words, if a person cannot make the repayments on the house, the lender, typically some form of bank, can repossess the house and sell the house to repay the loan.
House prices rising faster than income
Average house prices have been consistently rising faster than average income in most developed countries. The graph below shows the ratio of house prices to average income between 1981 and 2011.
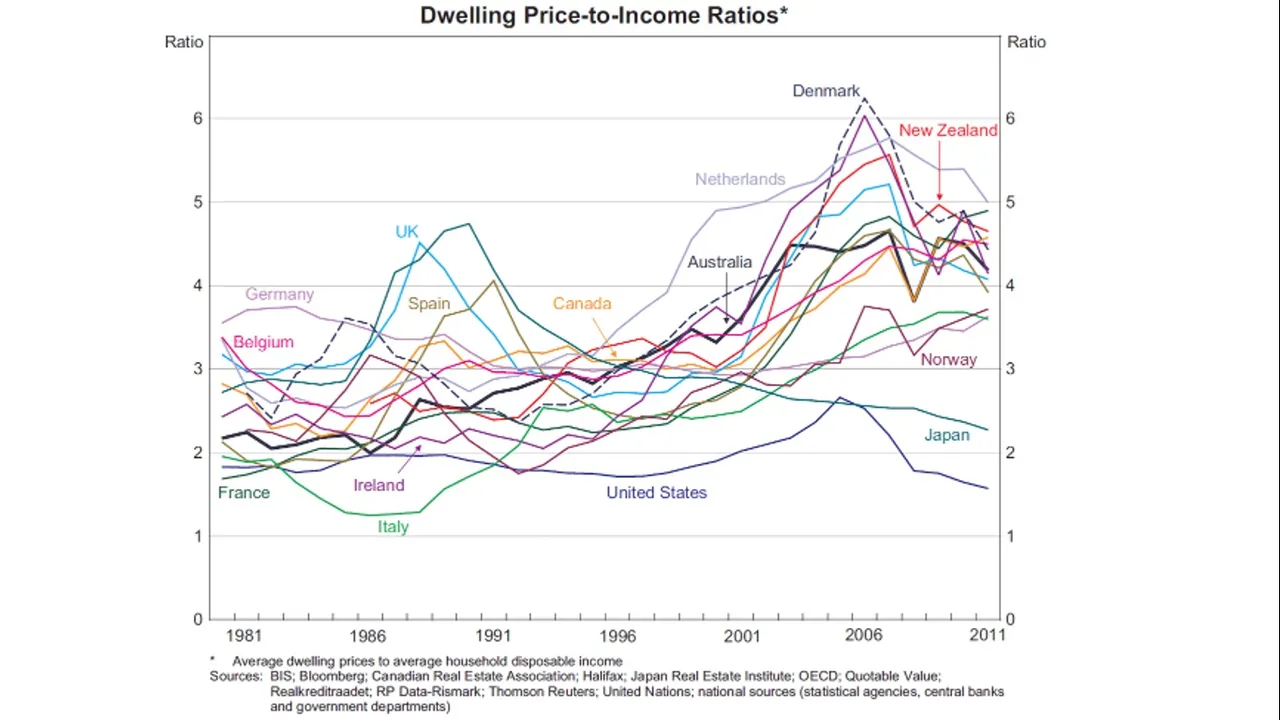
Source: http://rba.gov.au/publications/bulletin/2012/dec/2.html
As can be seen from the graph countries such as the United Kingdom, Australia, New Zealand, Netherlands, Denmark, Ireland, Italy, Canada, Belgium, Norway and Spain all experience increasing house price to income ratios. Germany and the United States of America indicate roughly constant house price to income ratios between 1981 and 2011. Japan appears to be the only country where house price to income ratios are falling.
In regards to Germany, since 2011 the German property market has increased substantially. The average property price in Germany is 40% higher in 2017 than in 2011. Whereas, the average gross monthly earning only increased by 15% over the same period. See the graphs below.
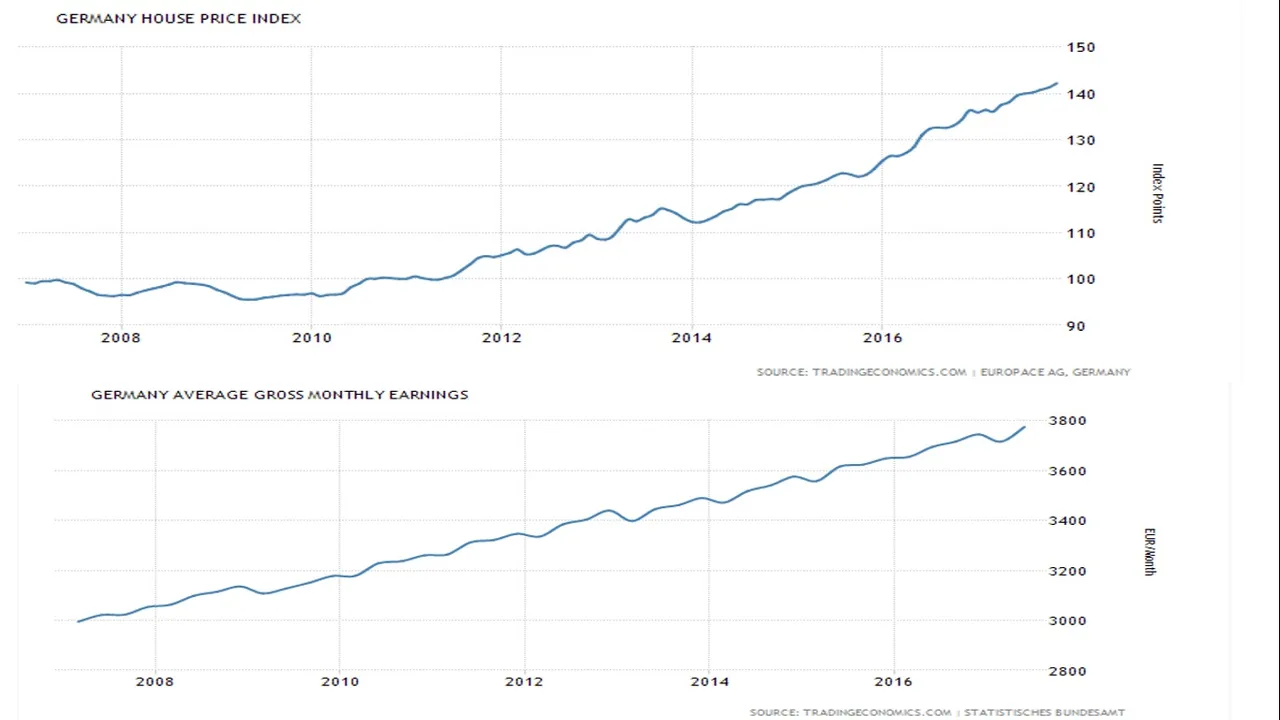
House price index (Source: https://tradingeconomics.com/germany/housing-index)
and
Average gross monthly earnings ( Source: https://tradingeconomics.com/germany/wages)
The problem is further compounded in Germany as average income is increasing mostly because of the increase in income of those in the 10% of highest income earners. See the graph and table below comparing income increases for those in the top 10%, middle 10% and bottom 10%.
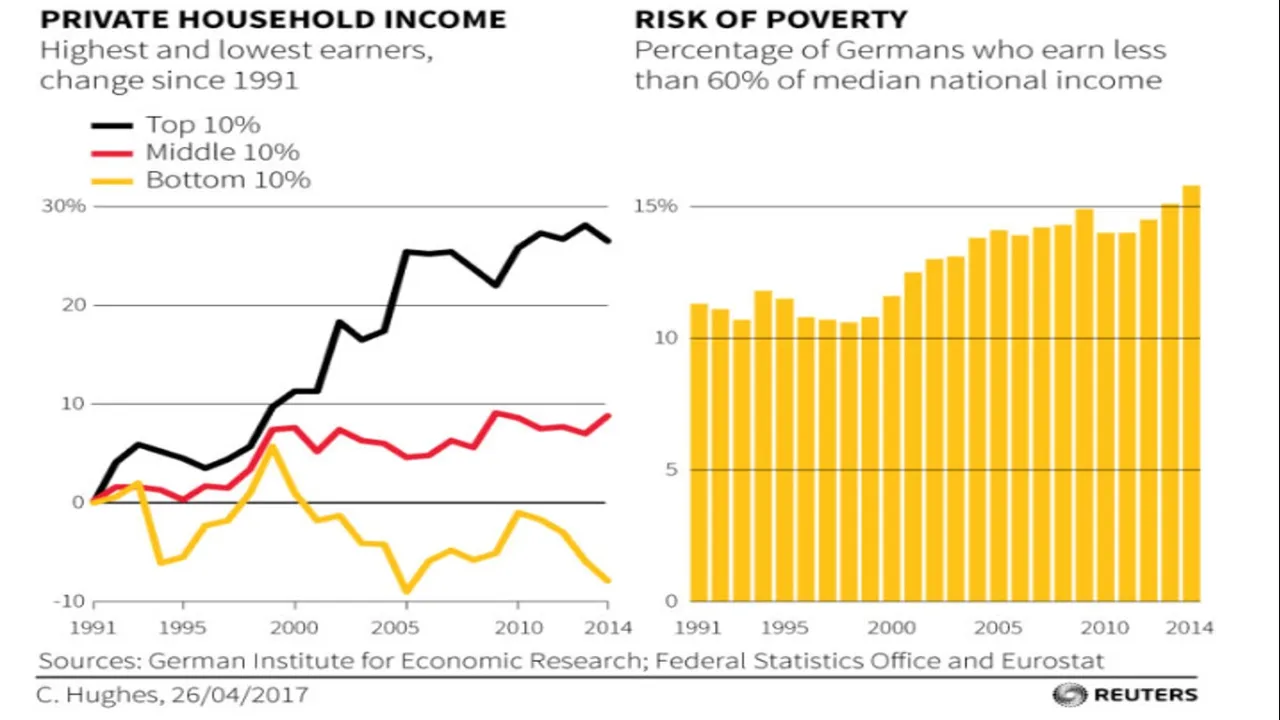
Source: https://www.vvox.it/2017/05/08/euro-poverta-non-vorrei-che-litalia-finisse-come-la-grecia/
The house price to income ratio in the United States of America also appeared reasonably constant between 1981 and 2011. The income ratio shown in the graph relates to mean income rather than median income. If we look at house price to median income ratio we see a slightly different story. See the graph below.
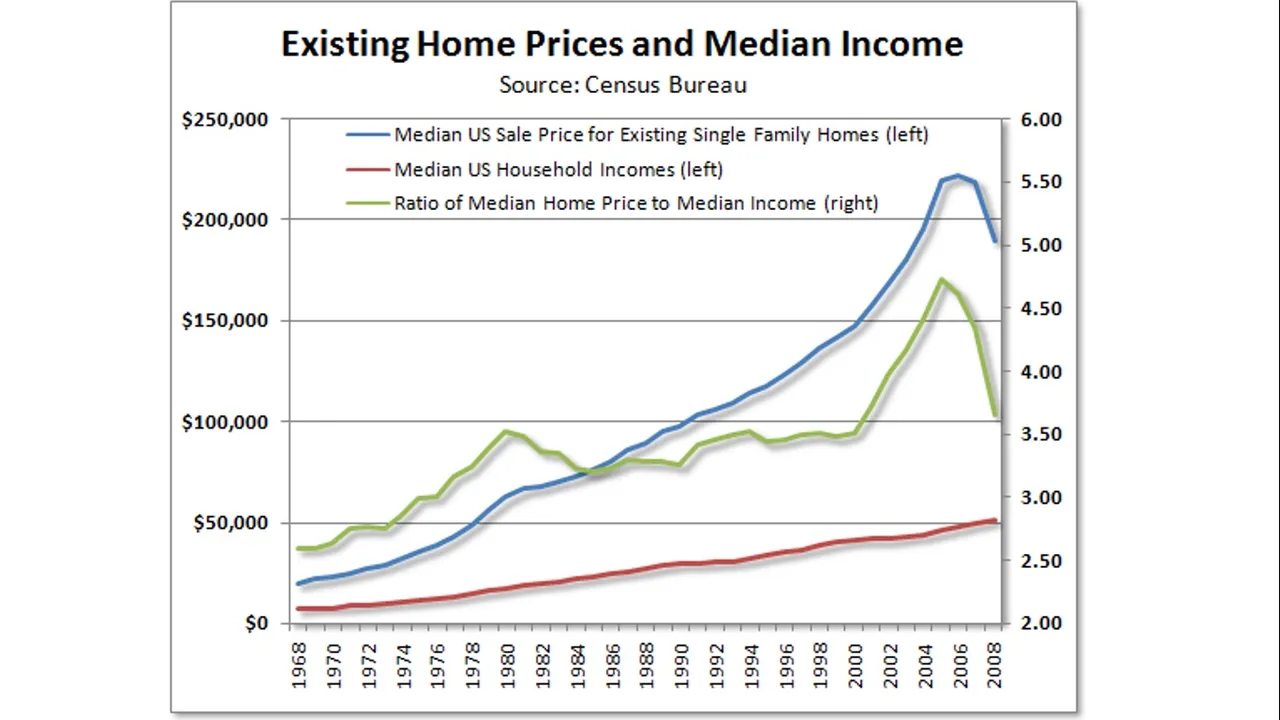
The graph also illustrates the difference between average (mean) income and median income in the USA. For example in 2006, the house price to average income is about 2.5, whereas, the house price to median income is about 4.75.
The graph below makes a comparison between median income and Gross Domestic Product per capita in the USA.
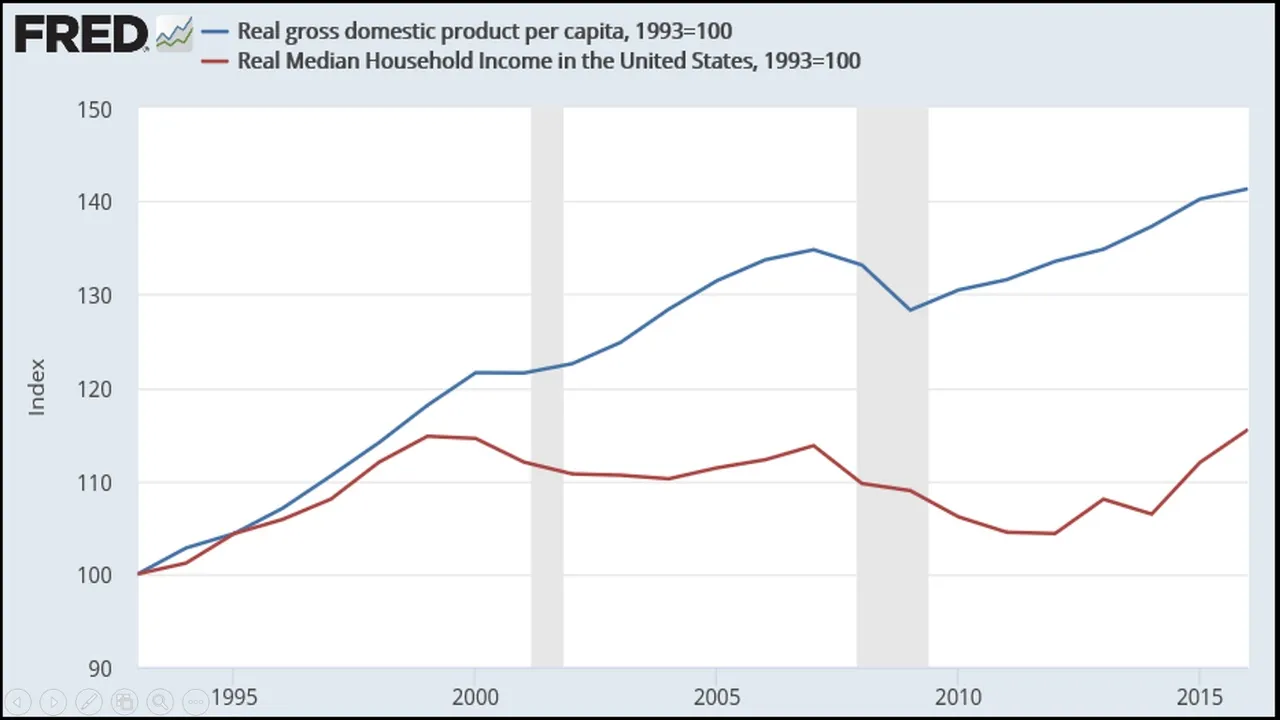
Source: https://www.nytimes.com/2014/09/17/upshot/you-cant-feed-a-family-with-gdp.html
What does an increasing house price to income ratio imply?
We have established that the house price to income ratio is increasing for most developed countries. For some countries that ratio has close to doubled. So what does this ratio mean? The ratio indicates the number of times more the average price of properties are than the average annual disposable income. High ratios indicate lack of affordability of houses.
So where are properties least affordable, rural or urban areas? Both the United Kingdom and Australia appear to indicate that house prices are climbing faster in urban areas. The higher house prices are pushing the house price to income ratio up. The graph below compares the house price to income ratios of London compared with the rest of the UK.
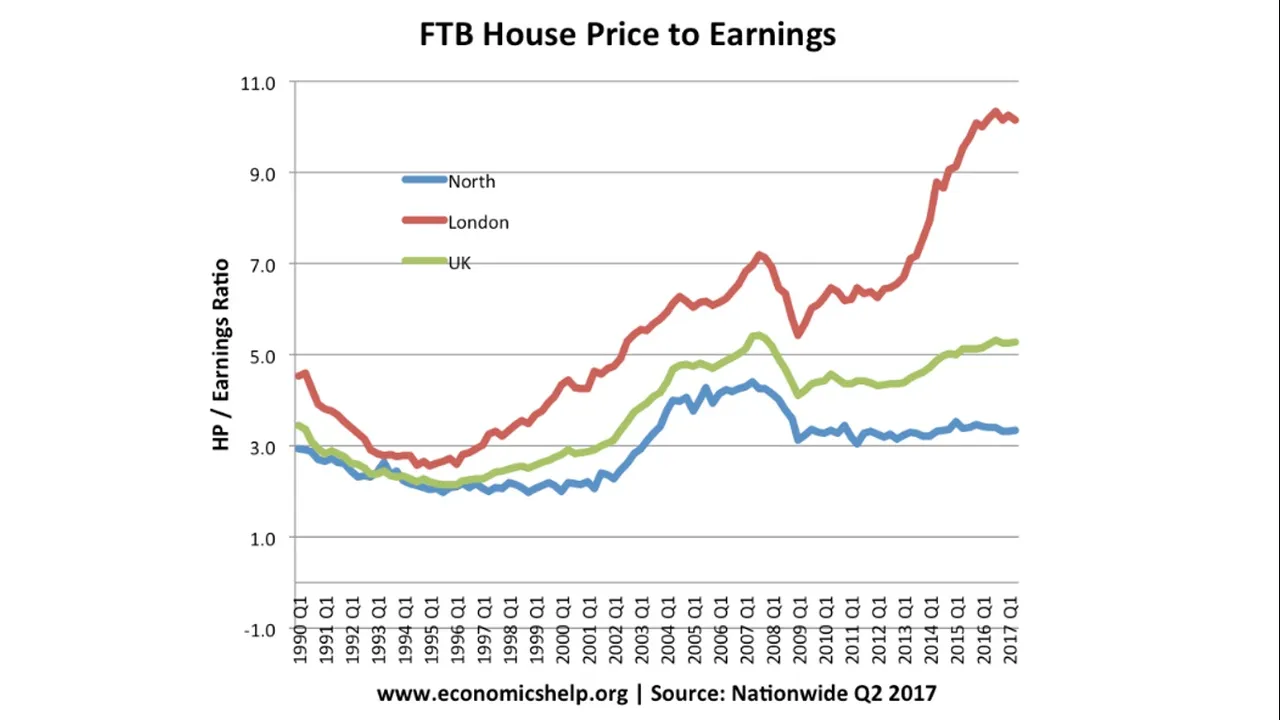
Source: https://www.economicshelp.org/blog/5568/housing/uk-house-price-affordability/
The ratio is increasing fastest in London, this is particularly true from 2009 to 2017.
The house price to income ratio is higher in Australian state capital cities than regional areas. The house price to income ratio increased substantially in cities between 1999 and 2005.
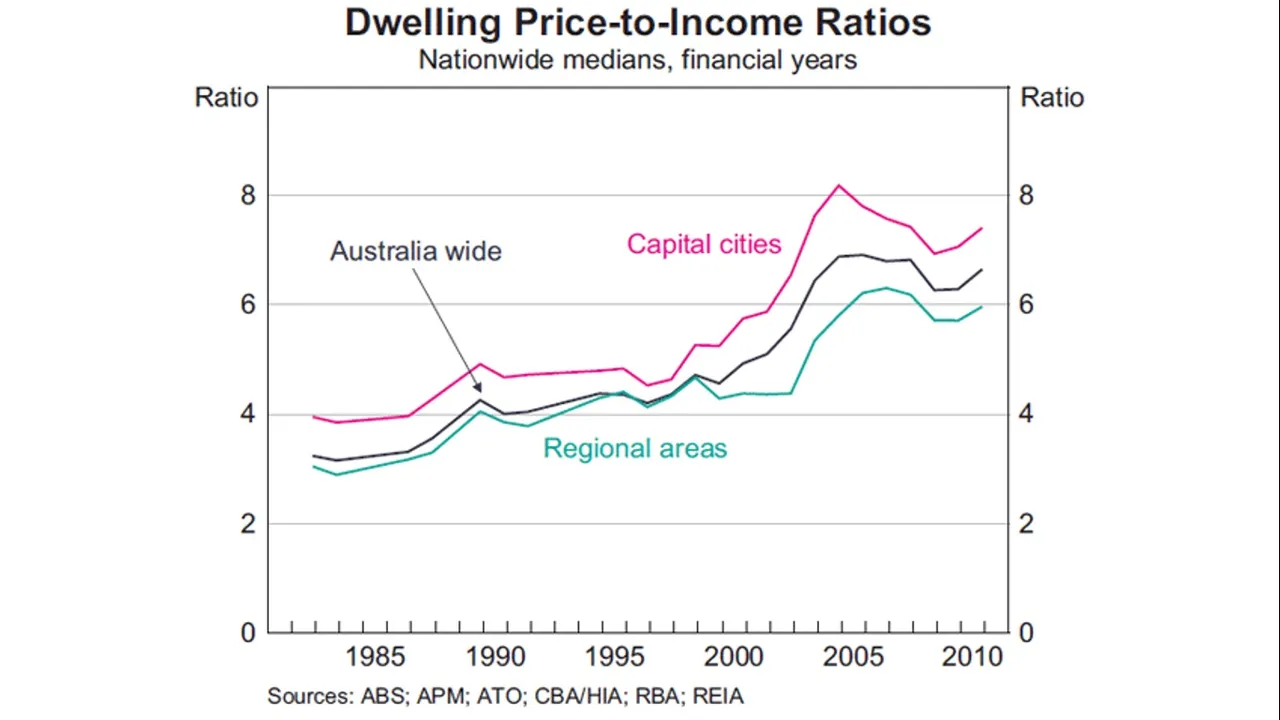
Source: https://www.rba.gov.au/publications/bulletin/2012/dec/pdf/bu-1212-2.pdf
House price to income ratios around the world
Let’s take a look at the house price to income ratios of some of the major cities around the world. The map below contains the house price to income ratios for several capital cities in 2017

Note: House price to income ratios may vary from website to website depending on how city limits and income/earnings have been defined. For example, the London house price ratio to income reported by www.economicshelp.org is substantially low than the value reported in the map above.
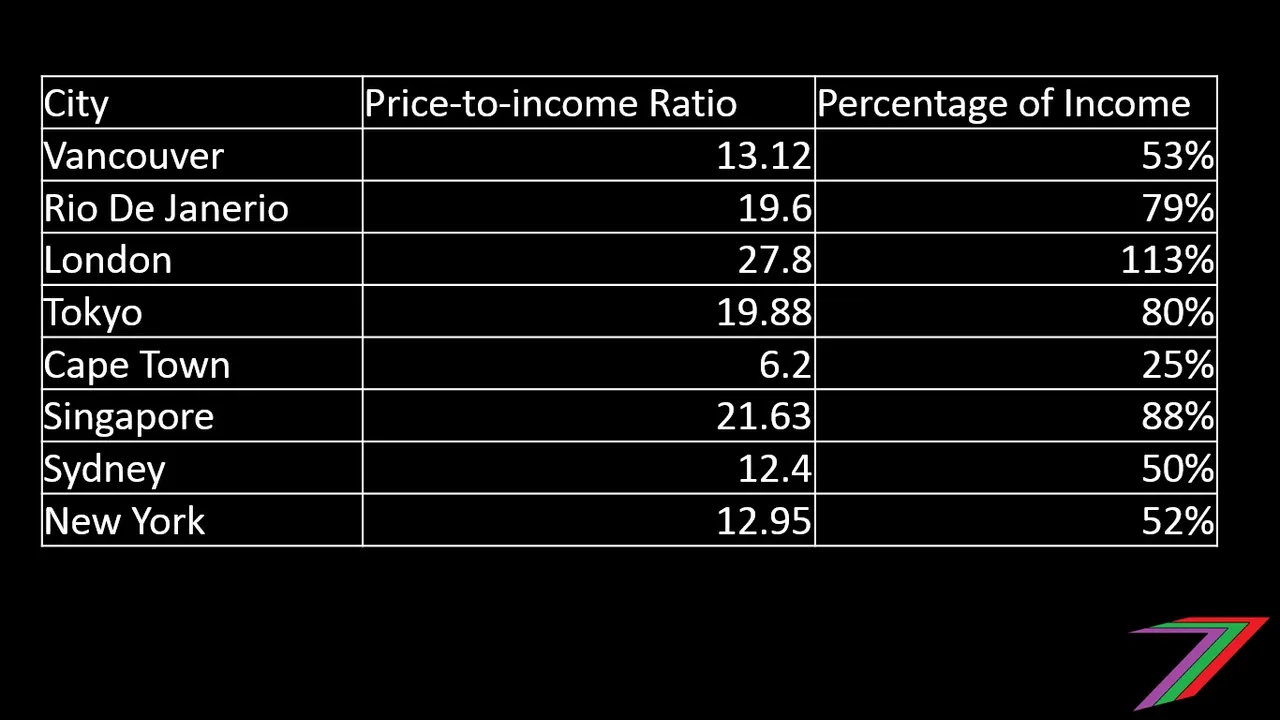
So roughly, how affordable are houses in these cities? Let’s assume 30 year mortgages at an interest rate of 3% (this will vary considerably from country to country) and a 20% down payment. What percentage of the average earning person’s annual income is required to pay for the annual mortgage repayments of an average priced property? The table contains the percentages for a few selected cities around the world.
Percentage of Individual Income required to pay for mortgage of an averaged priced house
Note: Mortgage repayment calculations performed using yourmotgage.com calculator available at:
https://www.yourmortgage.com.au/calculators/home-loan-repayment/
These percentages are far higher than the recommended 30% of annual income to be spent on accommodation. These numbers also indicate that many people cannot afford to own their own homes. The fall in home ownership in many western countries demonstrates the lack of affordable housing.
Home ownership in England at 30 year low.
Home ownership in Australia has been declining for three decades.
Home ownership in the USA is lowest since the census began in 1965.
In Canada, home ownership is down from 69% in 2011 to 67.8% in 2016.
How do people survive with such high expenditure on accommodation?
Let’s take the UK for example. For about 50% of couples, both parents work full time. For another about 40% of couples, one parent works full time while the other works part-time. Almost 50% of people are looking for additional work outside regular working hours. If we also deduct the number of people that do not have mortgages because they cannot afford the down payment or repayments and factor in the exceedingly low interest rate in the UK, the percentage of household income spent on accommodation is closer to the more desirable 30%. The table below shows the percentage of household income spent on mortgage repayment in the UK.
Mortgage payments as percentage of income and interest rates over time
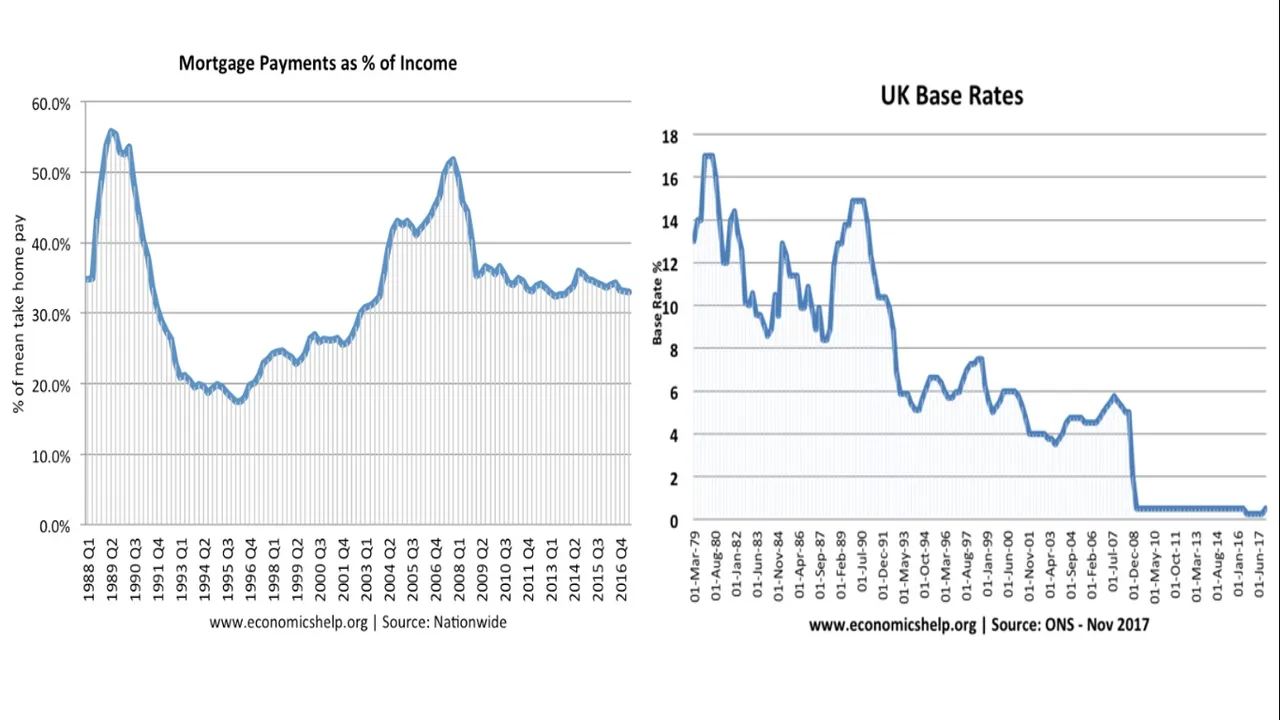
Source: https://www.workingfamilies.org.uk/wp-content/uploads/2017/01/Modern-Families-Index_Full-Report.pdf
For the factors mentioned above, the percentage of household income spent on mortgage repayment is plausible. This has come at the expensive of dramatically increased total household paid working hours. Extra working hours incurs additional costs such as day care for children and additional transport cost. The very low interest rate makes this possible as well. If the interest rate was to increase even by as small as 0.5% (approximately 6.5% increase in monthly mortgage repayments), many households would be in dire financial problems.
So why are house prices so high?
We can look at it from a demand and supply perspective. Let’s start with supply. Supply of housing is going to be limited in the city. There are only so many houses a city can hold. Limited supply forces people to compete to obtain these houses. Hence the price of houses go up.
Let’s take a look at demand. In 1900, 14% of the world lived in cities. In 1950, 30% of the world lived in cities. In 2008, more than 50% of the world lived in cities. In developed countries, approximately 74% of the population currently live in cities. It is projected that approximately 70% of the world will live in cities by 2050. Source

Increasing demand and a limit on supply forces house prices up. That is not the only pressure on house prices. Lower down payment requirements on houses creates the illusion of affordability. The percentage of home owners that did not have a down payment on their homes increased dramatically in the USA from 1998 to 2006
Percentage of zero down payment home purchases in California
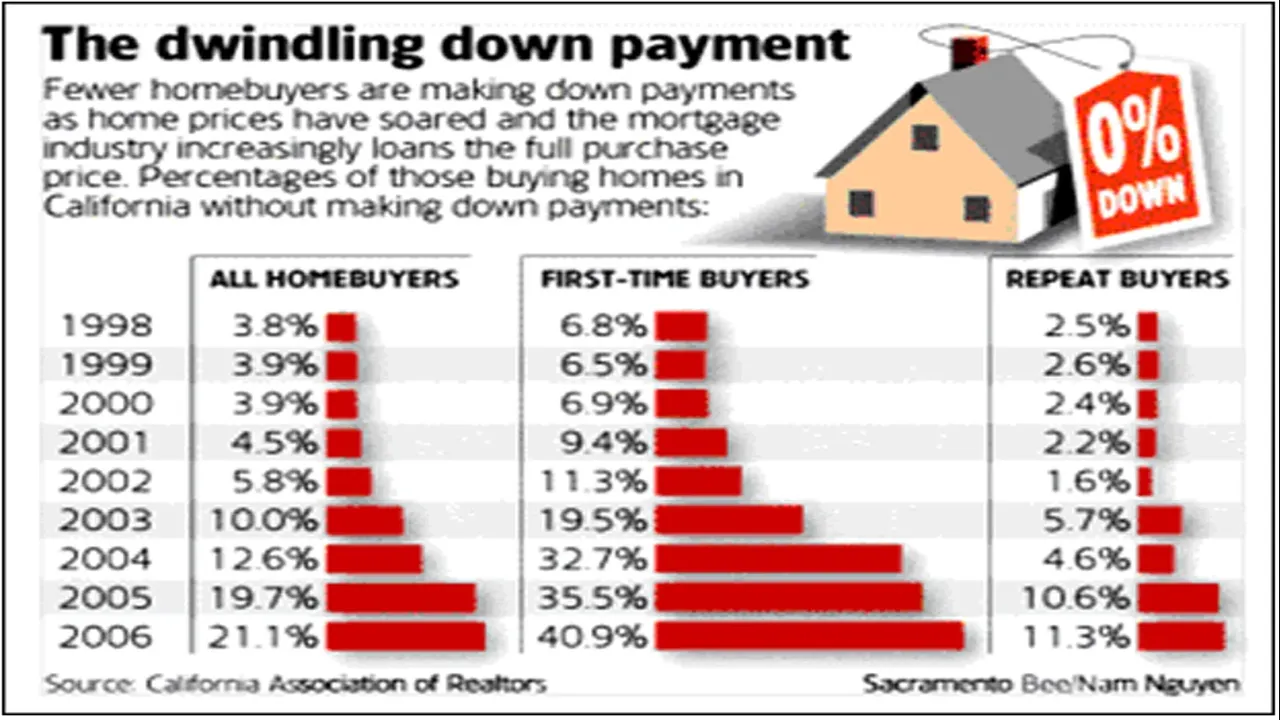
Source: https://ridgeliner7.wordpress.com/2008/10/16/examining-the-causes-of-the-credit-crisis-of-2008/
Lower down payments further stimulates demand for houses and thus pushes the prices of houses even higher. The demand supply graph below demonstrates how house prices can be pushed higher because of lower or no down payments.
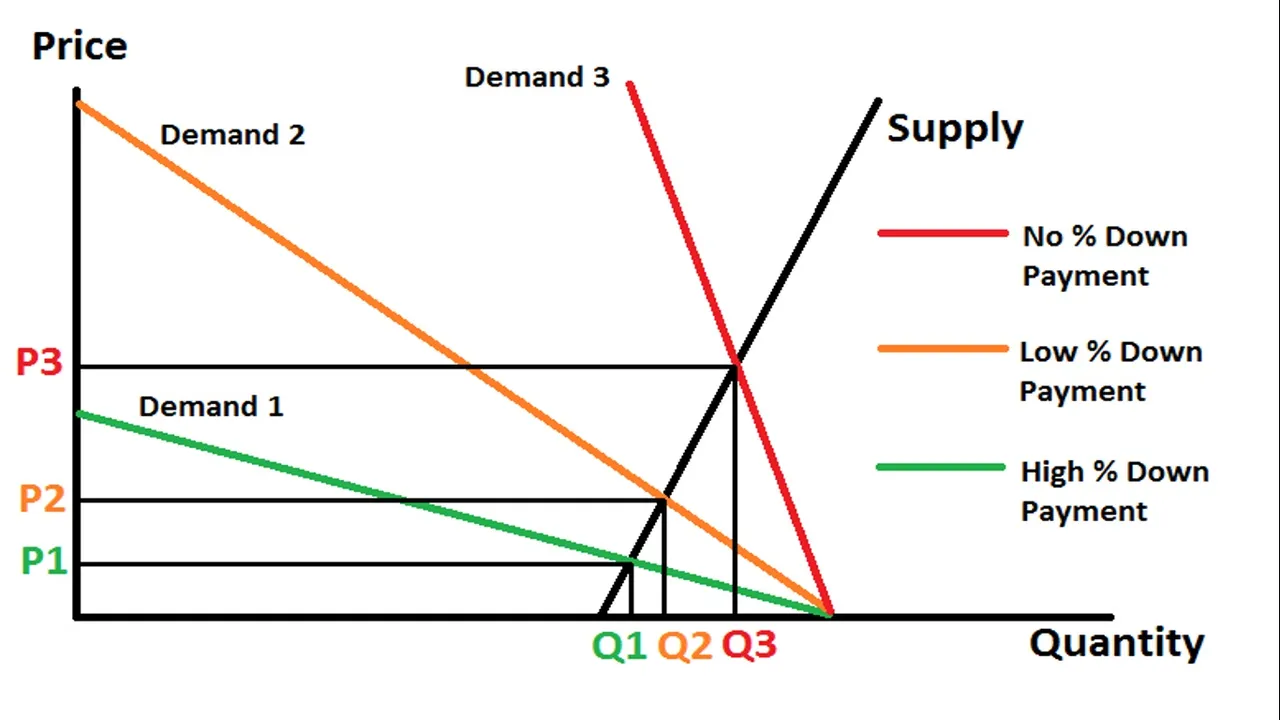
A no down payment scenario makes buying a house possible for people that have close to zero savings. All these additional people that can get into the housing market adds significant pressure on prices. What makes things worse is that the problem is self-perpetuating as the high house prices make it even more difficult for people to enter the housing market unless a very low down payment is allowed.
The increase in number of investment properties is also adding to demand. Very low down payment requirements make it easier for people to acquire multiple properties, hence pushes the price of properties up and forcing those with less wealth into renting. Those that cannot afford a home rent from those that have multiple properties. Those that buy multiple properties with very low down payments are putting themselves at extreme risk as the amount of debt accumulated for all properties can be enormous. Even a short period without tenants could result in an inability to make mortgage payments on the investment properties.

Government programs do not support people who desire to place a higher down payment on properties. In the USA, programs such as Veteran Affairs (VA) and Federal Housing Administration (FHA) loans do not offer better terms to those who are willing to pay higher down payments. Therefore, many people do not pay higher down payments as there is no incentive to do so. Source
Who benefits from high house prices?
There are a few groups of people that benefits from increasing house prices. They are:
- Those that entered the housing market back when housing was affordable
- Those that own their houses outright
- Those that own multiple properties outright
- Banks
- Government
Those that bought houses when prices were low benefit from higher valued properties without the high repayments of those just entering the market. This group are only partial winners as higher house prices will require the owners to pay higher rates to councils and government. If the owners have no intention of leaving the property market, the gain in value in the property may never be realised.
Those that own their properties outright do not have to worry about increasing interest rates. Higher house prices also means a higher payout when they want to leave the housing market. Those that own multiple properties outright can gain from increasing investment property prices as well as charge higher rent as prices increases. Owning investment property also provides tax breaks to owners as well. Most of these tax breaks are for owners who still have mortgages on their properties. This is yet another incentive by the government for people to stay in debt.

Banks are the biggest winners when it comes to higher house prices. Banks can make more, larger and longer loans. The current low interest rates are also enticing many people into getting fixed rate mortgages to protect themselves from future mortgage rate rises. The graph below shows bank profits provided by the bank of Canada.
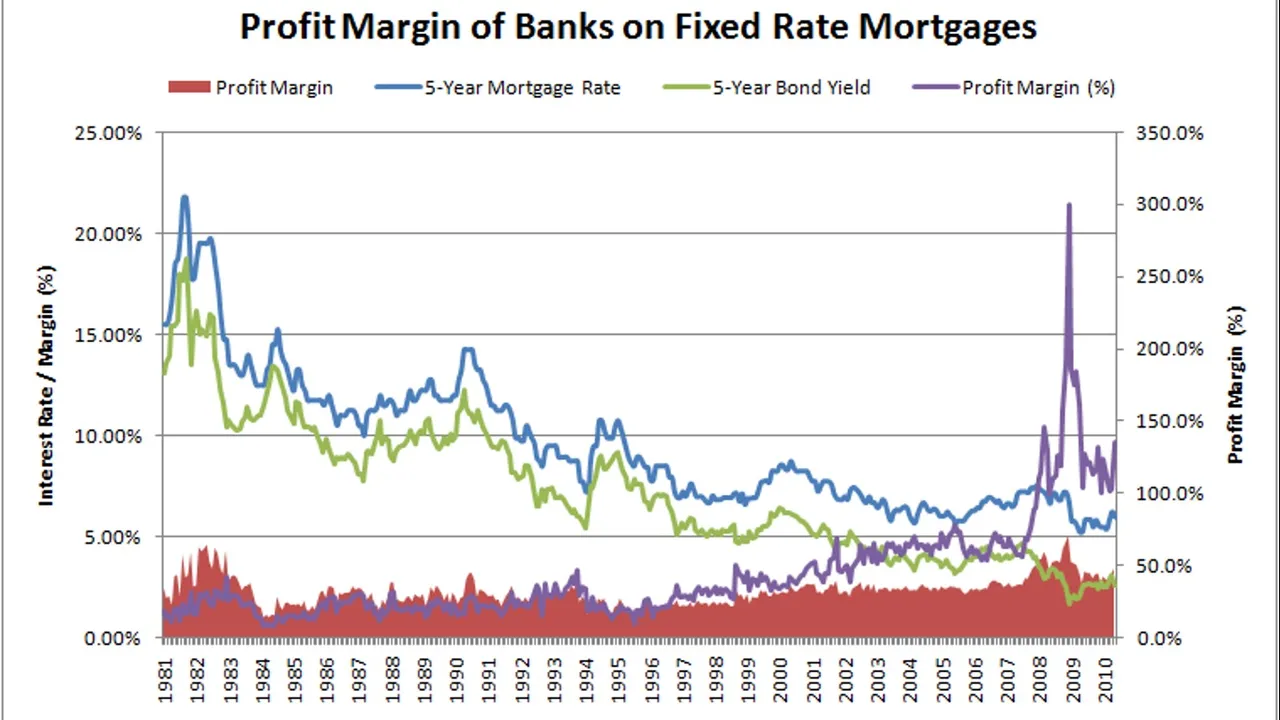
Source: https://takloo.wordpress.com/2010/06/12/profit-margins-on-fixed-rate-mortgages/
Another winner from higher prices are governments. Higher property prices allow government to charge higher property rates. If property prices increase, government can also benefit from capital gains tax from property sold as well. Governments often use high property prices as a selling point for their government as a claim that the people are becoming wealthier by owning more expensive properties.
Summary
The high house price to income ratio is making us slaves to the mortgage. Many people are faced with mortgages that they struggle to meet, which forces them to live from paycheck-to-paycheck. Many other people cannot afford to buy a home even on a mortgage and are forced to settle with living in rented accommodation, which many people also struggle to make payments.

Another thing that is concerning is that banks and government treat property as a form of investment rather than a consumer durable (consumer durables are goods that have a long life). Homes are meant to be lived in, the moment they are treated as investments, the more unaffordable they will become. Do not buy more properties that you do not need, you are only adding to the problem.
Thank you for taking the time to read my post. I hope you have found the content interesting. I will be writing more posts relating to mortgages and property prices in the weeks and months to come. These posts will focus on particular countries and cities. This initial post is more general in nature just to give the readers a more general idea of the extent of the problem of excessively high house prices.