This post contains a video which looks at three types of efficiency. They are productive efficiency, allocative efficiency, and Pareto efficiency. The Robinson Crusoe general equilibrium model is also used to explain efficiency.
Productive Efficiency
Productive efficiency looks at the efficiency of the production of outputs. Productive efficiency is often explained using a Production Possibility Frontier (PPF). The Production Possibility Frontier is a line/curve/function that shows all the possible combinations of outputs with full employment of factors of production. The Production Possibility Frontier does not consider the distribution of outputs or the utility obtained from them. The Production Possibility Frontier is explained in the figure below.

In Figure above, there are three points. Point A is not productive efficient as it is possible to produce both more of Good Y and Good X with the resources available in the economy. Point B is productive efficient as in order to produce more of Good Y, less of Good X needs to be produced and vice versa. All resources are being utilized without waste. Point C is not productive efficient as it is unattainable with the resources available in the economy. Point C may become productive efficient through improvements in technology, increased population, improved specialisation or international trade.
Allocative Efficiency
Allocative efficiency looks at optimizing the net benefit obtained from outputs. Allocative efficiency is typically achieved when the marginal cost of production equals the marginal benefit of consumption. Allocative efficiency generally only occurs in perfectly competitive markets. Allocative efficiency is described in the figure below.
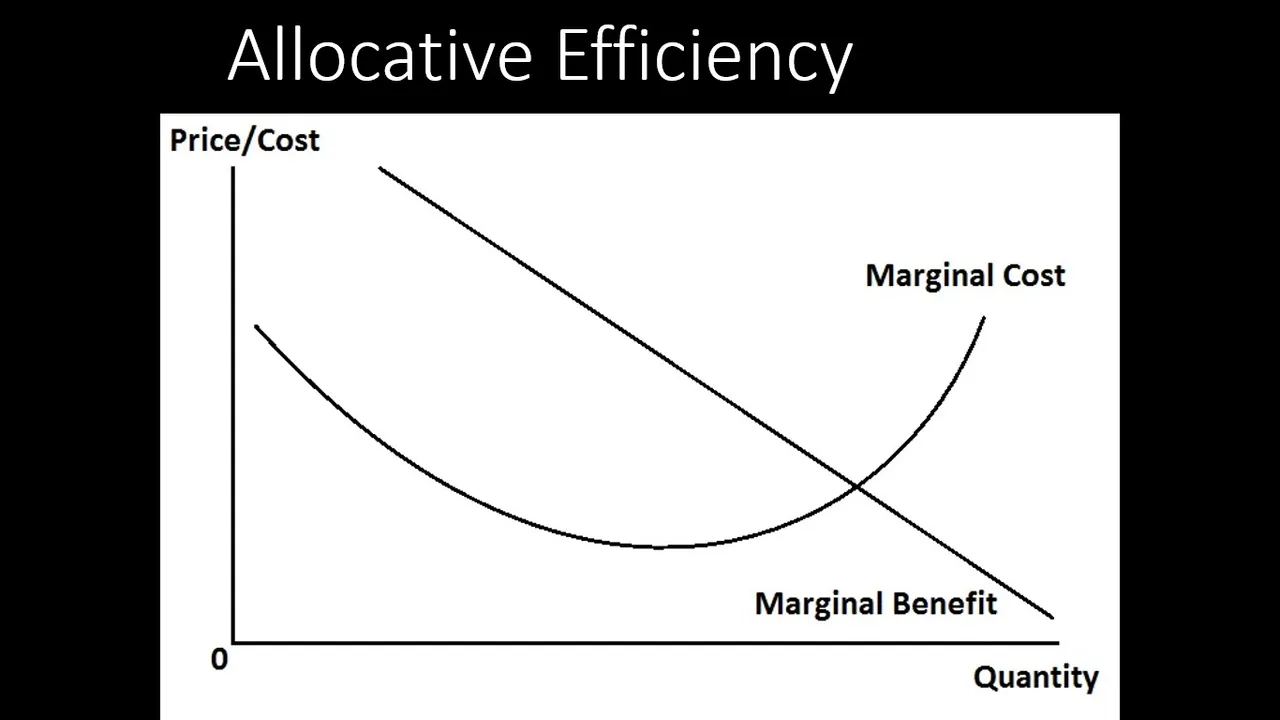
Marginal costs are the additional costs of producing the next unit of a good or service. Marginal costs tend to be modelled as initially decreasing from improved efficiency from mass production (economies of scale). Decreasing marginal costs are typically not sustainable as coordination of factors of production such as labour becomes more difficult on a very large scale (diseconomies of scale). Diseconomies of scale are most apparent in industries dominated by a few large organisations and in Government departments. From a whole of industry perspective, scarcity of resources is often blamed for rising costs of production.
Marginal costs normally only include the costs to the producers of the good or service and does not include costs borne by external parties. Some industries are regulated through taxation and subsidies in attempt to equate costs borne by the producers to the social costs of production. Social costs of production include costs to external parties. Not all external costs can be captured and many are not even attempted to be captured.
Marginal benefits are the additional benefits from each additional good or service consumed. Marginal benefit is typically viewed as the maximum amount of money consumers are willing and able to pay for the next unit of that good or service. Marginal benefits are nearly always considered to fall as more of a good or service is consumed. For example eating chips, the first few chips provide greater enjoyment than the hundredth chip. This is because our need for food has been met and our desire to continue eating chips has fallen greatly.
Marginal benefits normally only include the benefits to the direct consumers of the goods or services and does not include benefits to external parties. Subsidies are sometimes used to encourage greater consumption of a good or service if it is considered to benefit those around them or have longer term benefits that are not fully perceived by those consuming the goods and services at the time. Subsidies can also be used to increase the consumption of goods and services that benefit powerful organisations that manipulate and control Governments.
Pareto Efficiency
Pareto efficiency aims to achieve a world where it is not possible to make someone better off without making someone else worse off. This implies that productive efficiency also exists as all resources are optimally used. Pareto efficiency is typically explained using the Edgeworth Box. The Edgeworth Box maps indifference curves. The tangents of the indifference curves are the Pareto efficient outputs. The contract curve consists of all the Pareto efficient points in the Edgeworth Box. Pareto efficiency does not consider if overall utility is maximised. Pareto efficiency is explained in the Edgeworth Box shown in the figure below.
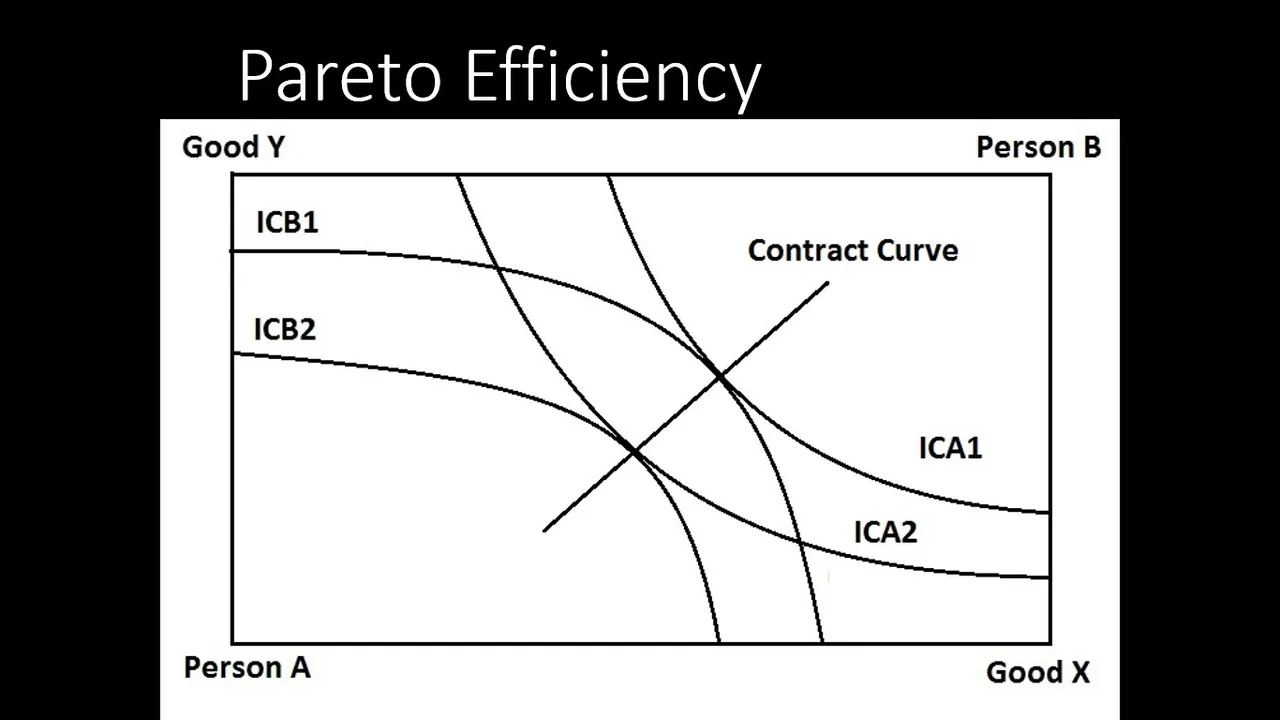
The Edgeworth Box in the figure above shows two people. Person A’s utility is represented by indifference curves ICA1 and ICA2. Indifference curve ICA1 provides Person A with more utility than indifference curve ICA2. Person A is able to consume more of goods A and B on ICA1, therefore, can obtain higher utility. Person B’s utility is represented by indifference curves ICB2 and ICB1. Indifference curve ICB2 provides Person B with more utility than indifference curve ICB1. Person B is able to consume more of goods A and B on ICB2, therefore, can obtain higher utility.
In the figure, Points B and C are at Pareto Equilibrium. Points A and D are not Pareto Equilibrium points. For example at Point A, Person A can obtain more utility by moving from Point A on indifference curve ICA2 to point B on indifference curve ICA1 and Person B can remain on Indifference curve ICB1. For example at Point D, Person B can obtain more utility by moving from Point D on indifference curve ICB1 to Point C on indifference curve ICB2 and Person A can remain on Indifference curve ICA2.
Robinson Crusoe Model
Efficiency can be explored using basic general equilibrium. The Robinson Crusoe model looks at a very basic economy consisting of production and consumption of goods and services. Efficiency can be achieved using the Robinson Crusoe model by using the Production Possibility Frontier and the composite indifference curve for the community. The tangent intercept indicates the efficient level of production and consumption for this economy. The figure below provides an example of the efficiency achieved using the Robinson Crusoe Model.
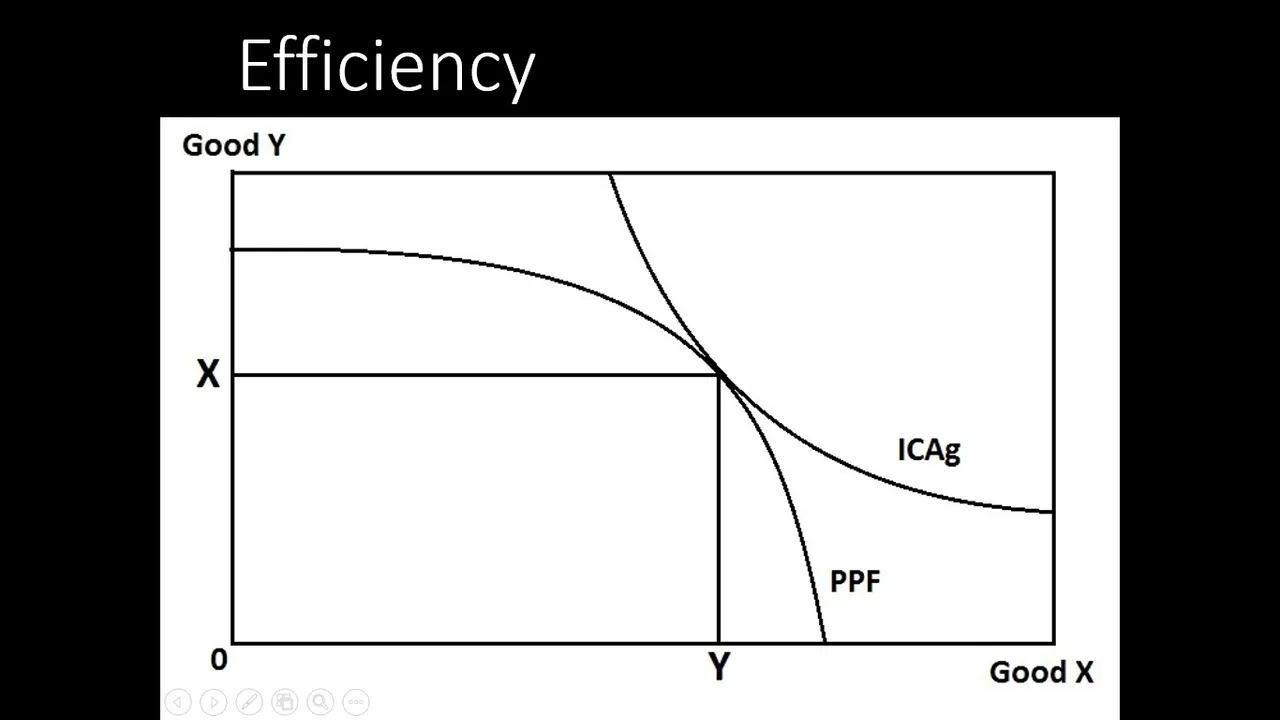
ICAg is the composite indifference curve of the population and is tangent with the PPF. Therefore, the optimal quantities of Good X and Good Y are X and Y respectively. This model is aimed at maximizing utility for the community using optimal production as well as optimal allocation of resources. In theory, this model appears ideal but in reality the world is far more complex with many unknowns. There are many complex General Equilibrium models but the accuracy of these models are very difficult to prove. Simple models often provide a better general approach to efficiency than the complex models that rely heavily on assumptions.
I hope you enjoyed this post and accompanying video. I will be posting more videos on economics soon.
The video can be watched at the link below:

More videos relating to microeconomics can be accessed at:

The official Spectrum Economics website can be accessed at: https://www.spectrumecons.com
For more exciting videos go to my YouTube channel at https://www.youtube.com/channel/UCILwyLtjl7ZTlYOqFkAwLzw
You can find me on LinkedIn at: https://www.linkedin.com/in/waynedavies-spectrumecons/
You can find me on Facebook at: https://www.facebook.com/SpectrumEconomics/
You can find me on Steemit at: https://steemit.com/@spectrumecons