Hi Everyone,
Today I will be getting back into my market structure series. So far I have provided a brief introduction to market structure as well as perfect competition and monopolistic competition. These posts have been quite scattered because of my recent Six Week Economics Challenge Series as well as my recent absence, I will explain more in future posts. I will provide links to the earlier posts in this series at the end of this post.
Quick recap
In this post, I will be covering the oligopoly market structure. Before I get into oligopoly I want to provide a quick recap of what I am covering in this series. I am covering 6 market structures. They are as follows:
- Perfect Competition
- Monopolistic Competition
- Oligopoly
- Monopoly
- Monopsony
- Oligopsony
The first four market structures in the list are typically discussed in detail in mainstream economic literature. Monopsony is sometimes discussed but in less detail and oligopsony is almost never discussed. Oligoposony might be perceived to have less real life application. I will cover oligopsony because of its real life relevance to Steemit and the Steem platform.
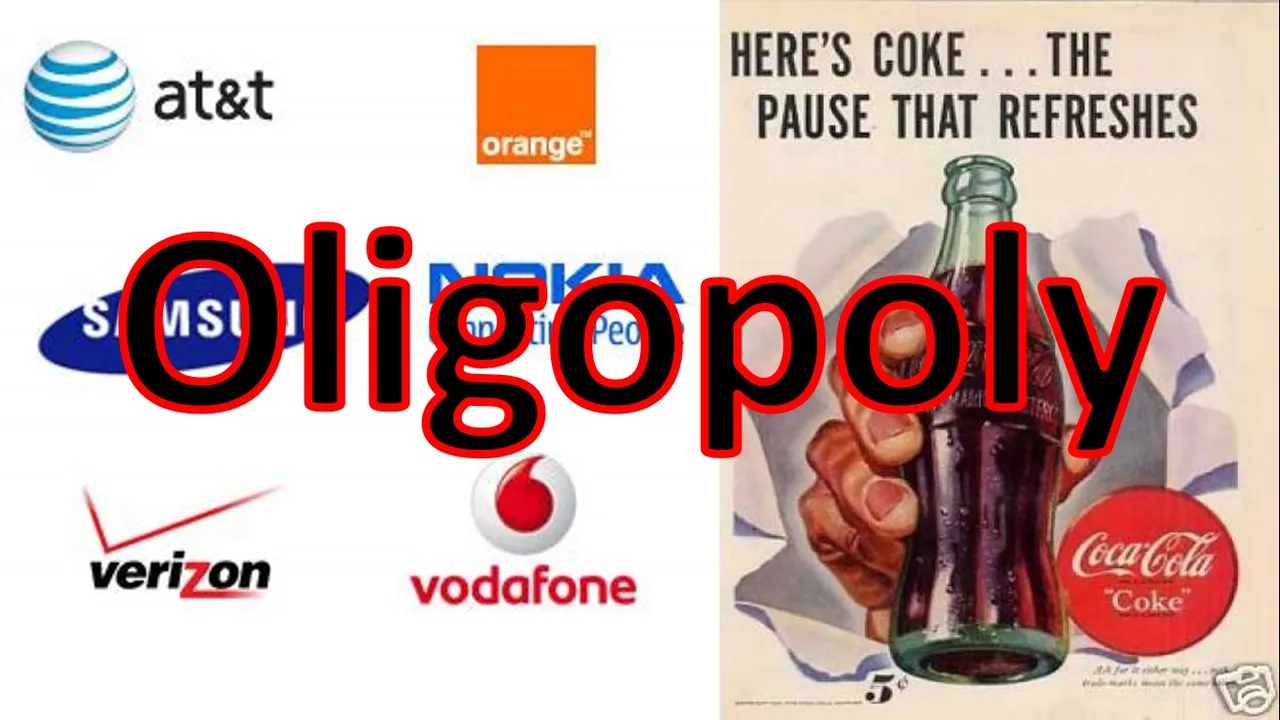
What is the oligopoly market structure?
An oligopoly consists of very few large firms and typically has many buyers. Products sold by oligopolies are not identical but tend to be very similar in nature. Oligopolies are likely to be profitable (supernormal profits in economics terminology) in both the short-run and long-run. Price collusion and barriers to entry help maintain profits. The oligopoly market structure has many real life examples, possibly the most of any market structure.
Oligopolies are normally created because of barriers to entry. Barriers to entry are any form of deterrent to new firms that want to enter into the industry. These barriers could relate to the nature of the business such as high start-up costs, prolonged economies of scale, and high fixed costs. Barriers to entry could relate to ownership of particular natural resources or infrastructure. Barriers could be caused by legal requirements such as patents and copyrights, or other forms of Government regulation. Oligopolies can be formed by the privatisation of Government monopolies.
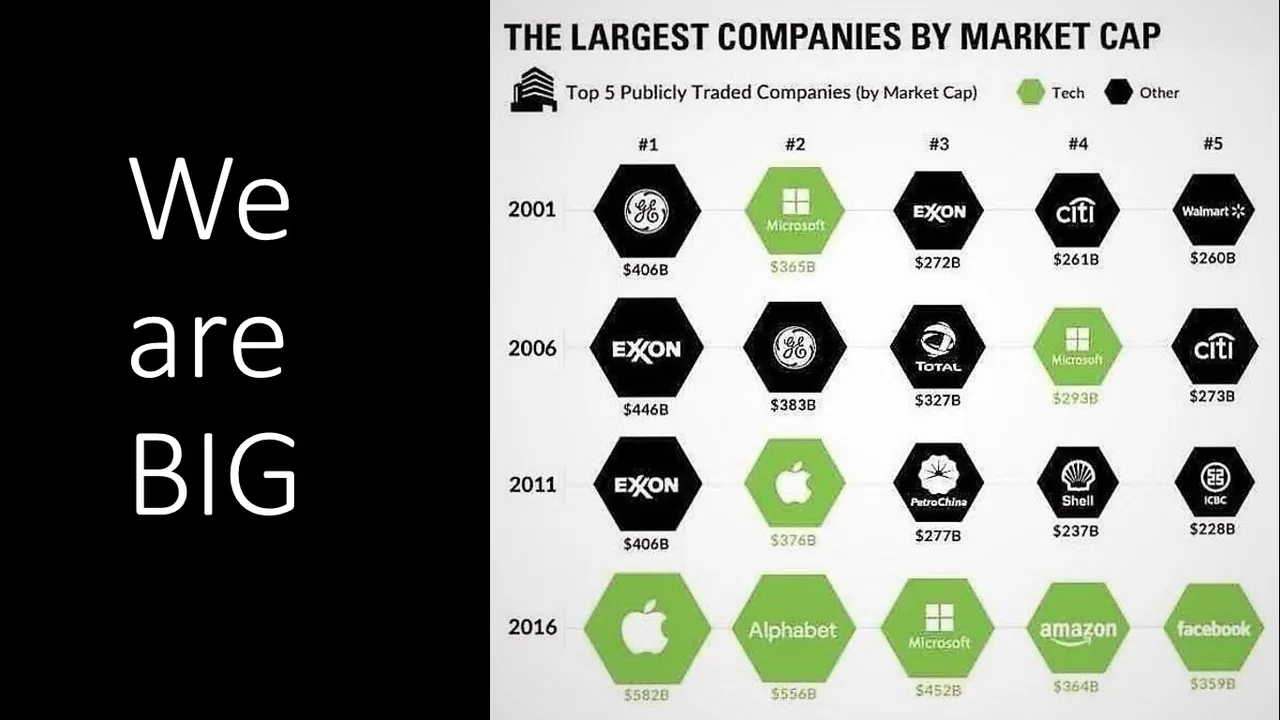
When we think of super large firms, we normally jump to the conclusion that they are monopolies. In reality, most of the largest firms in the world exist in oligopoly market structures. Take a look at the 5 largest firms by market cap shown in the picture above. Google (Alphabet) is the probably the closest firm to being a monopoly out of the top 5 from 2016. Microsoft was considered to have considerable monopoly power in the 1990s but it is difficult to argue that they are currently a monopoly.
Concentration Ratio
Concentration ratios are often used to determine if a particular market is likely to be an oligopoly. The market share of the largest 4 or 5 firms is compared to the overall market size. The higher the percentage of the market share owned by these firms, the more likely that the market structure is an oligopoly.
The Herfindahl-Hirschman index (HHI) is also used as an indicator of the level of market concentration. The index requires the market share of each firm in the industry. The market share is then squared and summated. For example, a market may have 20 firms. The largest 4 firms have a market share of 21% each and the remaining 16 firms have only a 1% market share each. HHI would be 1780 for this market (21^2 × 4 + 1^2 × 16 = 1780).
The example given demonstrates a moderately concentrated market based on the definition provided by the U.S. Department of Justice. They define competitive markets as HHI below 1500, moderately concentrated as between 1500 and 2500 and highly concentrated as above 2500. The maximum score is 10000 (Investopia). Considering my example of almost total dominance by 4 firms, which only achieved a score of barely over 1500, I certainly question the ranges put in place by the U.S. Department of Justice.
Kinked Demand Curve
The most notable feature relating to price, quantity and equilibrium in regards to an oligopoly market structure is the kinked demand curve. The demand curve is essentially two demand curves combined into one curve. Above the price, the demand is elastic and below the price, the demand is inelastic. The figure below demonstrates the kinked demand curve of an oligopoly.
Kinked Demand Curve
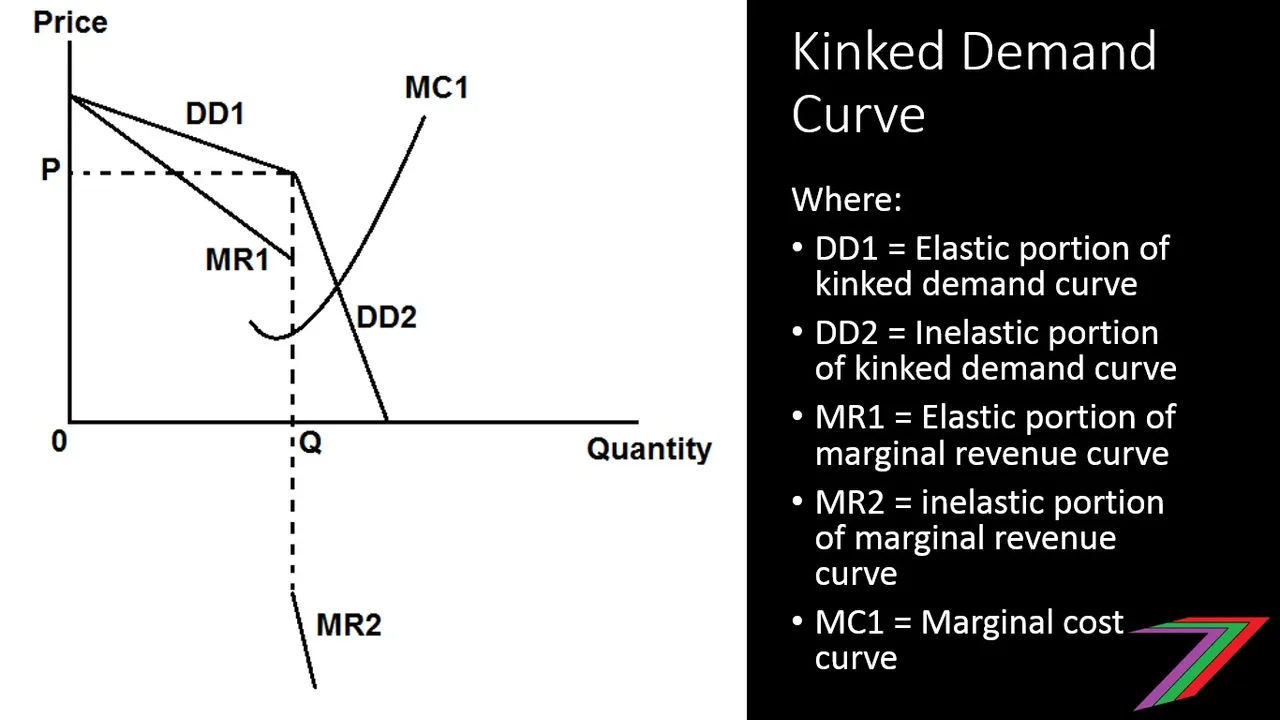
The demand above the price is elastic as buyers are assumed to switch to other brands that are priced lower. As goods and services are typically quite similar, this switch can be quite large; think of people switching to the lowest price mobile phone carrier when the price of the existing carrier increases.
The demand below the price is inelastic as competing firms will also lower their price to compete. When the other firms also lower their price people are not inclined to switch. The quantity demanded below the price only increases by the number of new users rather switching users. Therefore, the increase in quantity demanded is generally quite a bit smaller.
The kinked demand curve also causes price rigidity or sticky prices. Lowering price will result in a lower profit because of the inelastic demand curve. This can also be seen be the marginal revenue falling below zero (many kinked curves I saw online do not accurately represent negative marginal revenue). Increasing price will result in a loss of profit as well because of the elastic demand curve. The percentage loss in quantity demanded will be greater than the percentage gain in price. Marginal costs can move along the dotted line shown in the figure above, there will be no incentive by any firms to change price as such change will lower profits.
So how is equilibrium determined? How is the kink formed in the first place? The largest firms generally come to an agreement regarding what price to set. The price needs to be low enough for inelastic demand to exist below the kink and high enough for elastic demand to exist above the kink. The price cannot be too high to attract attention as collusion but high enough for the largest firms to make supernormal profits. It is possible other market structures such as monopolistic competition could also have a kinked demand curve but it is less likely as coordinating and making agreements between more firms is considerably more difficult.
Examples of oligopoly
There are many examples of oligopolies in the world and these examples will vary from country, so do not worry if I have missed some out or if I have listed a market that happens to be a monopolistically competitive market instead. The following are markets that can be typically classified as oligopolies.
- Motor vehicles
- Computers
- Printers and scanners
- Internet browsers
- Computer software
- Credit cards
- Petrol
- Mobile phones
- Mobile phone carriers
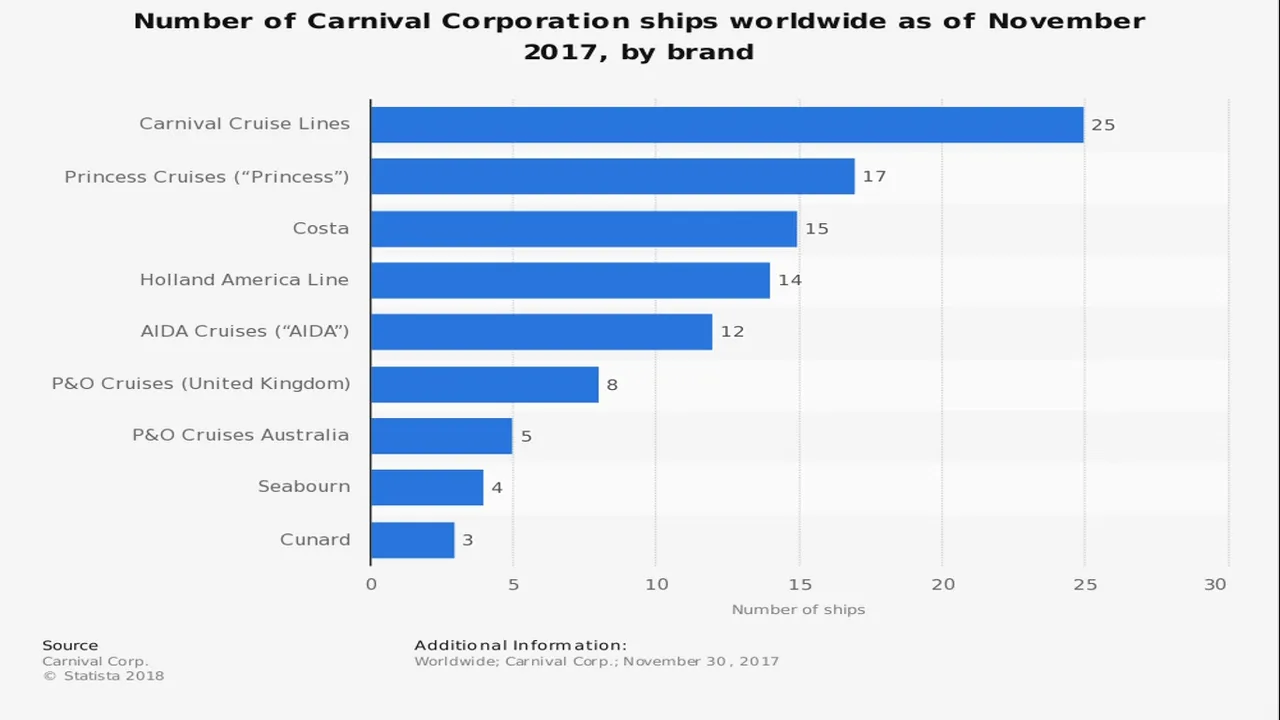
- Cruise liners
- Airlines
- Mainstream media
- Television and films
- Beer
Concerns regarding oligopolies

So far, I have defined some of the key characteristics of oligopolies as well as how price and quantity is determined. I have not discussed some of the problems or weaknesses of the oligopoly market structure.
I will start with the more obvious and clearly defined weaknesses such as allocative inefficiency. The kinked demand curve results in higher prices and lower quantities to be efficient. Both perfect competition and monopolistic competition can be expected to have greater allocative efficiency as well as lower prices. If the market fits naturally into an oligopoly market structure because of economies of scale (ability to produce large quantities at a lower cost), it is possible that even though appearing highly allocative inefficient, lower prices can still be achieved. Perfectly competitive and monopolistic competitive market structures have small firms that cannot exploit economies of scale by themselves (cooperation between firms in a monopolistically competitive market structure might be able to achieve certain economies of scale, see my post on monopolistic competition). Artificially created oligopolies are most likely to be more inefficient.
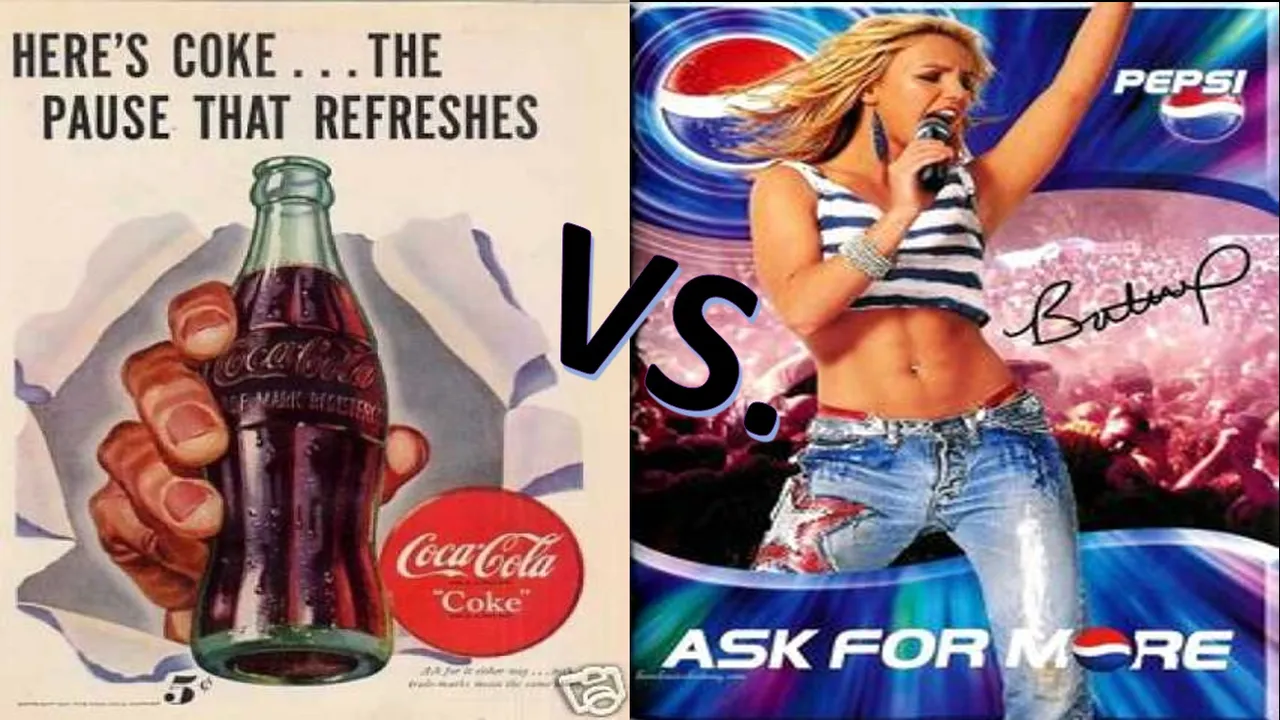
Firms in oligopolies often engage in wasteful advertising as price competition is limited and products are only marginally differentiated. Advertising is normally not informative but instead persuasive. A good example is the cola wars, Coca-Cola vs. Pepsi. The adverts contained lots of promoting of image around drinking either cola but almost nothing informative or useful about the product itself.
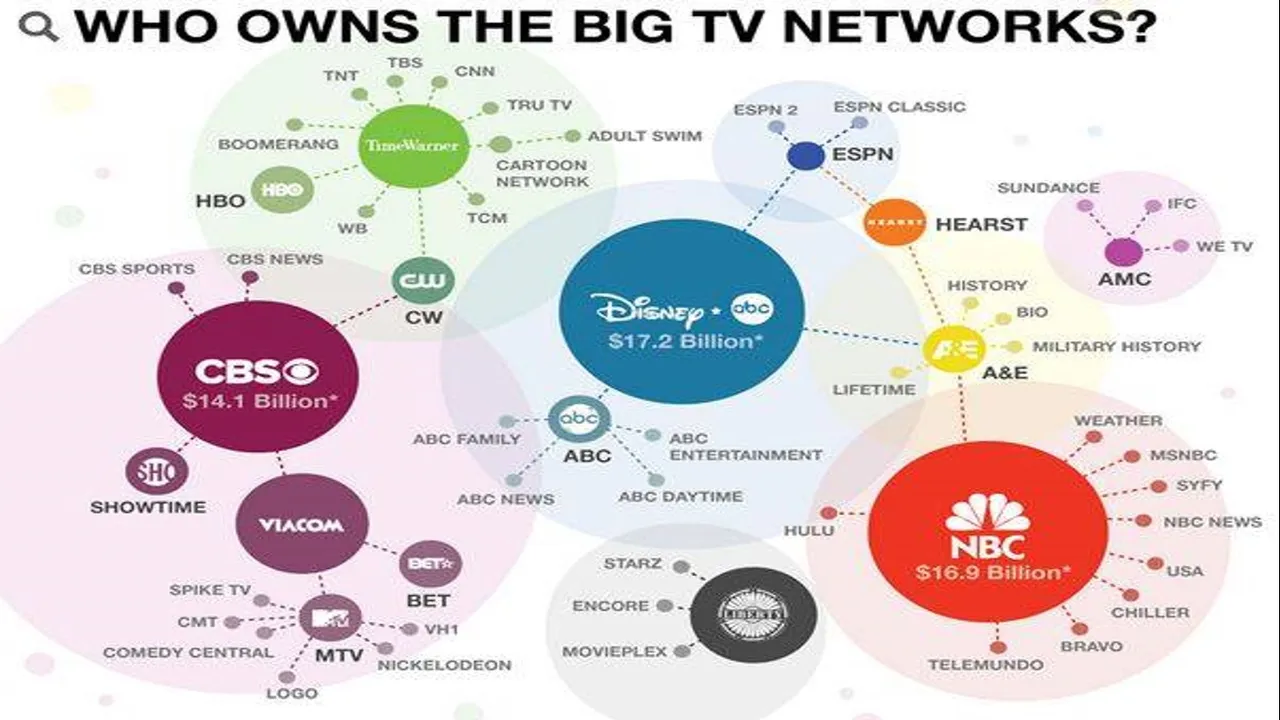
Oligopolies that we did not know were oligopolies
A market may appear to be full of competitors but in reality there are few competitors. Many of the brands are owned by one firm but it is not immediately obvious. Two important markets are television, and food and drink. Almost all television broadcast companies are owned by just six companies. They are as follows:
- News Corp
- Disney
- Time Warner
- CBS
- General Electric
- Viacom
The dominant food and drink companies are as follows:
- Nestle
- Coca-Cola
- Pepsico
- Associated British Foods
- Kellogg’s
- Mars
- Unilever
- Danone
- Mondelez
- General Mills
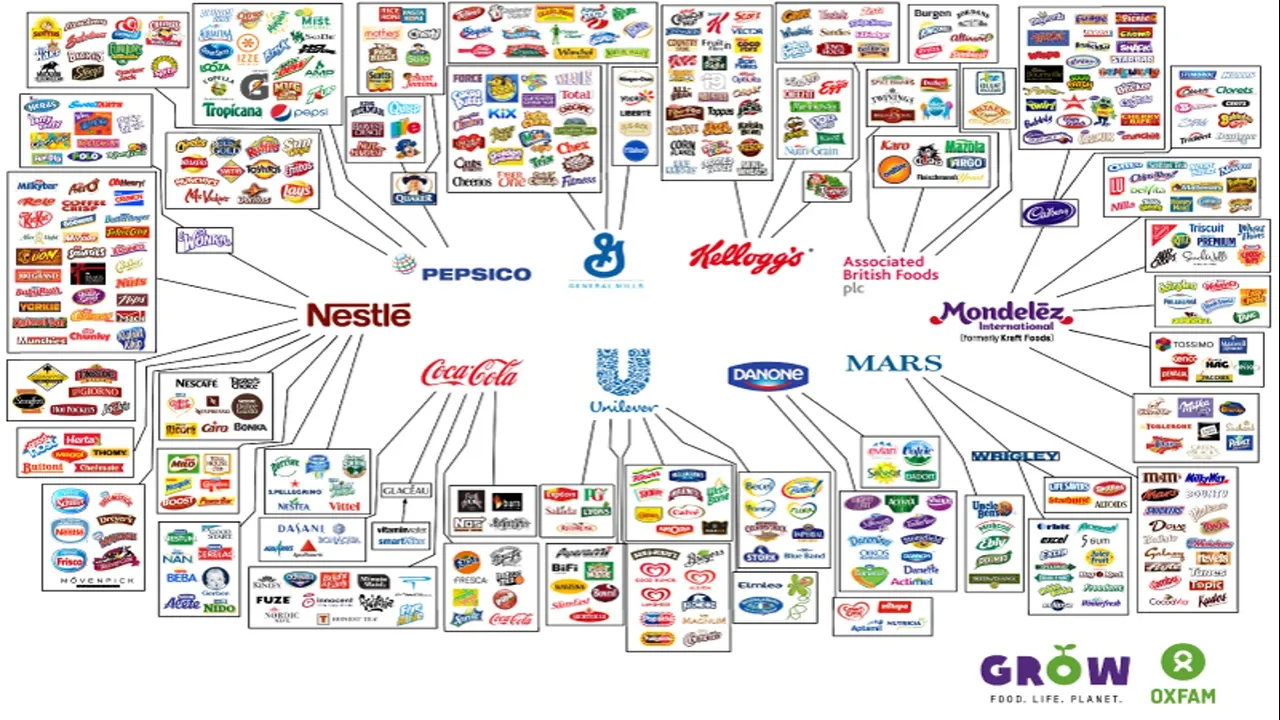
What we eat and drink and the sources of information and news that we receive comes from just a few firms. These are very important aspects of our lives entrusted to just a few firms. These mega firms came about through a combination of mergers and Government regulation. Food and drink markets could easily operate as monopolistic competitive markets where quantity produced would be higher, prices lower and there would also be a greater choice to buyers. News and media can be argued to have a much higher cost outlay and higher fixed costs but demand for media and news is very high. The market is big enough for a large number of large firms. Instead there are a few mega firms.
Key points of post

The following are key points that you should take away from this post.
- Oligopoly is a market structure that has many buyers and few sellers, and products are similar but not identical.
- Oligopoly facilitates product differentiation but this is generally quite minimal.
- Oligopoly does not produce an allocative efficient quantity of goods or services. Although, it is possible for costs to be reduced if significant economies of scale exist.
- Oligopolistic firms produce supernormal profits in both the short-run and the long-run.
- There are very high barriers to entry. These barriers are very effective at keeping out competition and preserving the profits of existing firms.
- Oligopolies engage heavily in advertising. Advertising is normally persuasive in nature rather informative. This type of advertising can be considered mostly a waste of resources.
- Oligopoly market structure has many real world examples.
- Oligopolies sometimes exist without being particularly obvious. This happens when other firms are taken over or mergers take place and these firms keep their existing name with little to no reference to the parent company. We can see this happening quite often in the food and drink as well as in media and news markets.
Thank you for taking the time to read this post. My next post in the series will be on monopoly. This market structure is always attracting a lot of attention even though this market structure very rarely occurs naturally. I am certainly not a fan of the monopoly market structure but it is certainly worth discussing. You will not have to wait as long for this post as I am dedicating much more time to my economics posts now that my challenge series has finished.
If you want a quick overview of the market structures I am covering in this series, you can use the link below to view the introduction post.

Perfect competition post can be accessed using the following link.

Monopolistic competition post can be accessed using the following link.