Hi Everyone,
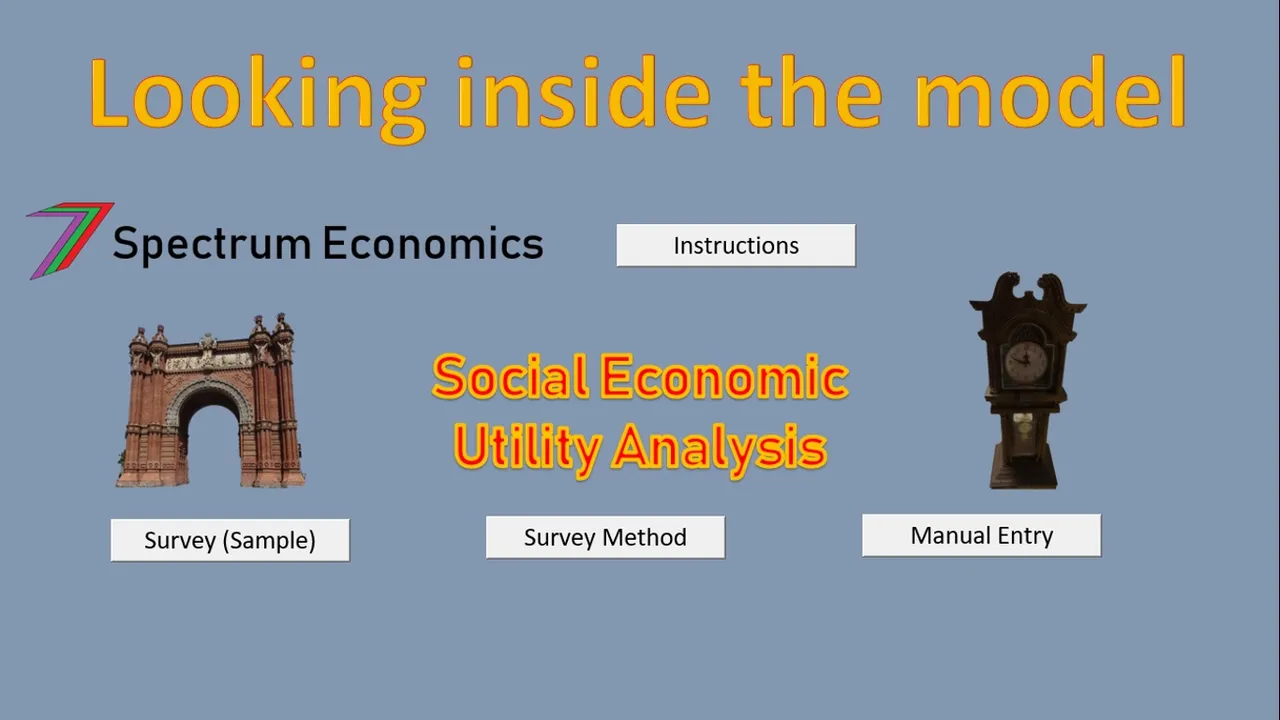
This post explains how the algorithms that I explained in my post ’Economic Social Utility Analysis (working title) Algorithms’ can be applied to a model.
Quick recap of approach

Before I jump into the model, I would like to provide a brief recap of what I have covered so far.
I have been investigating valuing quality of life as quality of time. Our lives are experienced through and across time. We can allocate our time to various to activities such as work, relaxation, sleep, eating etc. Different activities provide us with different levels of satisfaction. Paid work for example may provide less satisfaction per hour than being on vacation. The vacation may not be possible without engaging in paid work; travelling requires money. Therefore, income acquired from paid work can improve the quality of time not spent at work. These same arguments can be made about any usage of our time. My post ’Quality of life as quality of time’ elaborates on the above ideas.
Why create a model?
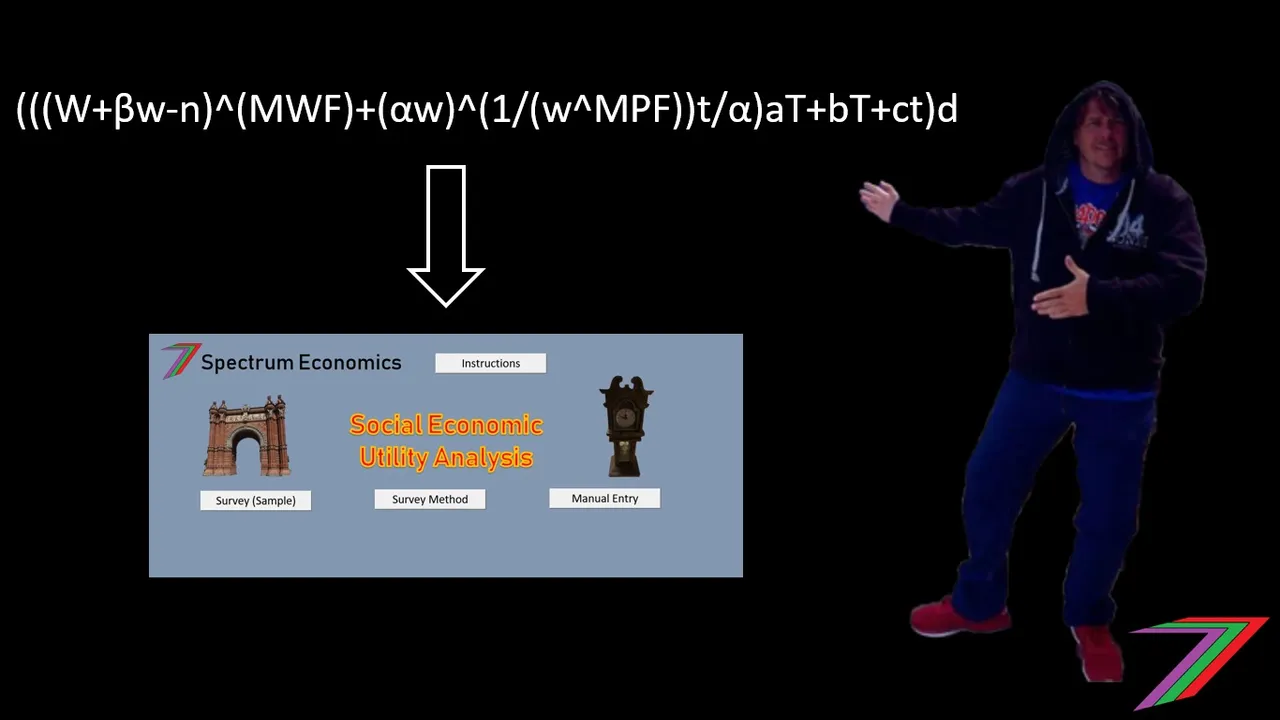
Creating an economic model enables consistent analysis of the application of the defined algorithms. The model provides a method to make comparisons between different usage of time as well as changes in parameters. The model also facilitates more detailed testing of the algorithms to determine if appropriate relationships between parameters and variables are being used.
The model can be used to indicate if people are using their time to maximise or close to maximise their utility (For more information on ‘utility’ you can read my post 'Economic Concepts #1 - Utility’). The model can also indicate changes in time usage if some of the parameters change. This can demonstrating sensitivity of time usage to any of the algorithm parameters. Therefore, this model can also be used to assess the impact of any initiative or activity that influences the parameters or the determinants of the parameters of the algorithms.
Getting started
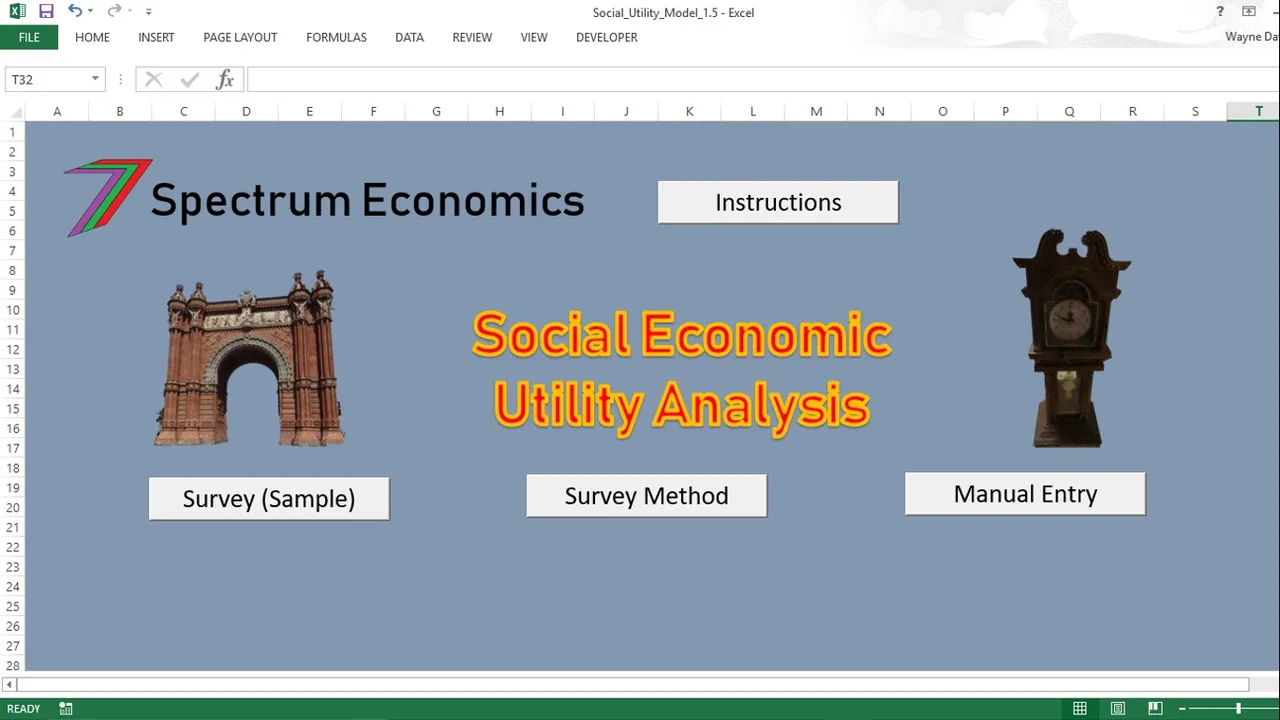
The model has a ‘cover page’ that enables access to the model’s instructions, and the two methods of determining the model’s parameters (survey and manual entry). The ideal place to start is with the instructions.
Instructions
The ‘instructions page’ provides a step-by-step guide to operating the model as well as explains the algorithms and the parameters and variables used in the algorithms.
Survey
The model accepts survey data or direct manual entry of parameters, which could have been determined by any other means. A sample survey can be accessed from the ‘cover page’. See survey below.

These questions serve as just a rough guide for the type of questions that could be asked. The responses are decoded to determine the values of parameters. Some of the answers to certain questions will shape the effect of the answers to other questions. For example, ‘strongly agreeing with the statement ‘your workplace encourages teamwork’ adds greater weight if the respondent ‘strongly agrees’ with the statement ‘you prefer teamwork rather than working alone’. The ‘sample survey page’ currently acts as the template for the model. Users can change the questions in the survey and these questions will be automatically changed throughout the model. The corresponding decoding of the answers to the questions will also need to be changed in accordance to any updates to the questions.
Individual surveys should be conducted. The results obtained from the surveys should be averaged to be entered into the model. The model allows for six sets (3 groups with 2 cases each) of survey results to be entered. The two cases allows for comparisons between data that could differ because of an event/activity/initiative that could alter responses to survey questions. The three groups enables results from surveys of people from different demographics to be compared.
Manual entry of parameter values
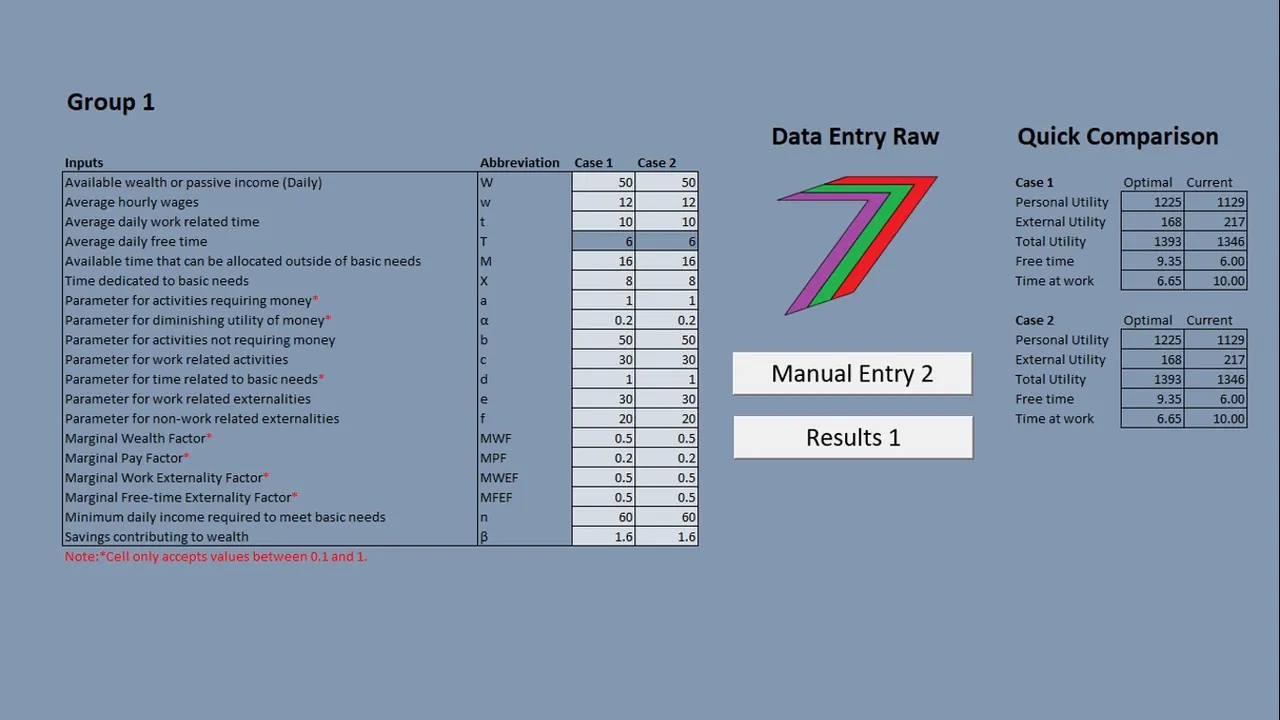
The use of surveys is not the only approach for collecting data to be used to determine parameter values for the algorithms. For data collected using alternative means, users can enter values directly into the model. As with the survey data, the user can enter values for two case for three groups of users. The 'manual entry page’ also provides the utility calculated for both cases from the parameters entered as well as the optimal time that should be allocated to paid work and unpaid alternative activities.
Results
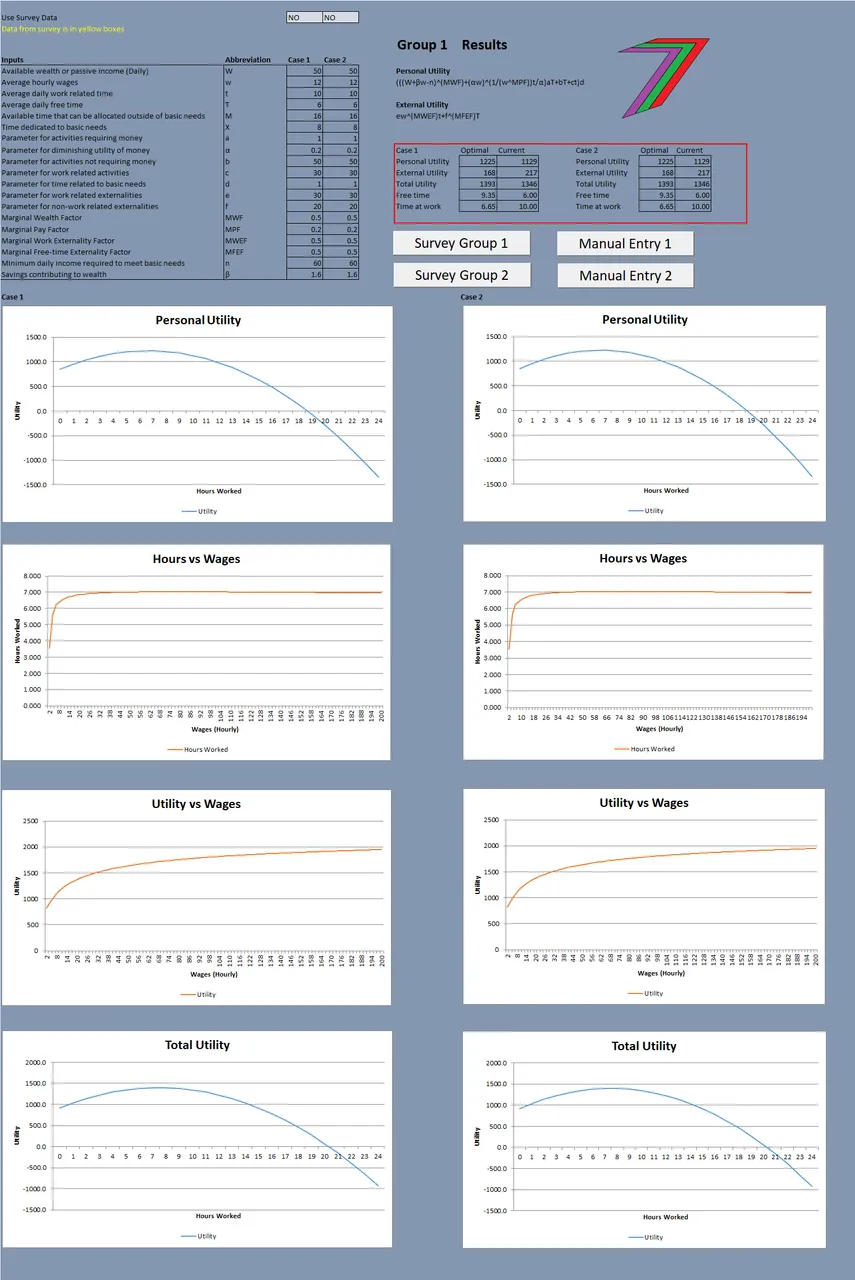
Results are provided for all three groups. Each 'results page' includes the calculated personal, external, and total utility for both cases as well as the optimal time that should be allocated to paid work and unpaid alternative activities. These results include parameters obtained with the built-in model surveys.
Each 'results page' also includes a graphical comparison between two modelled cases. The graphs include utility in respect to hours worked, hours worked in respect to hourly wages (backward bending supply curve), and utility in respect to wages (diminishing utility to higher income).
Overall Results
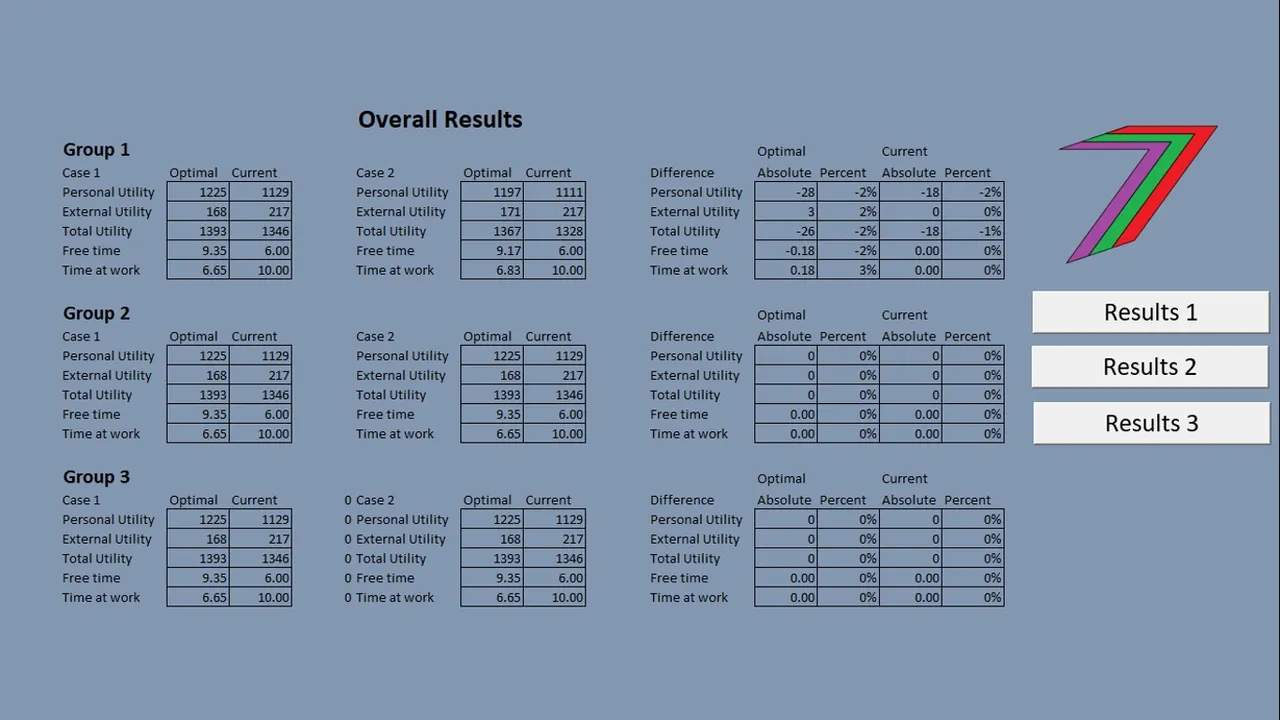
The model contains an overall results page that captures the results from all three groups. The results cannot be aggregated because of the nature of measuring utility; ‘utils’ the unit for utility does not have a consistent absolute value between users. The results can tell us if utility has increased or decreased as well as the percentage change utility.
Transitioning between pages
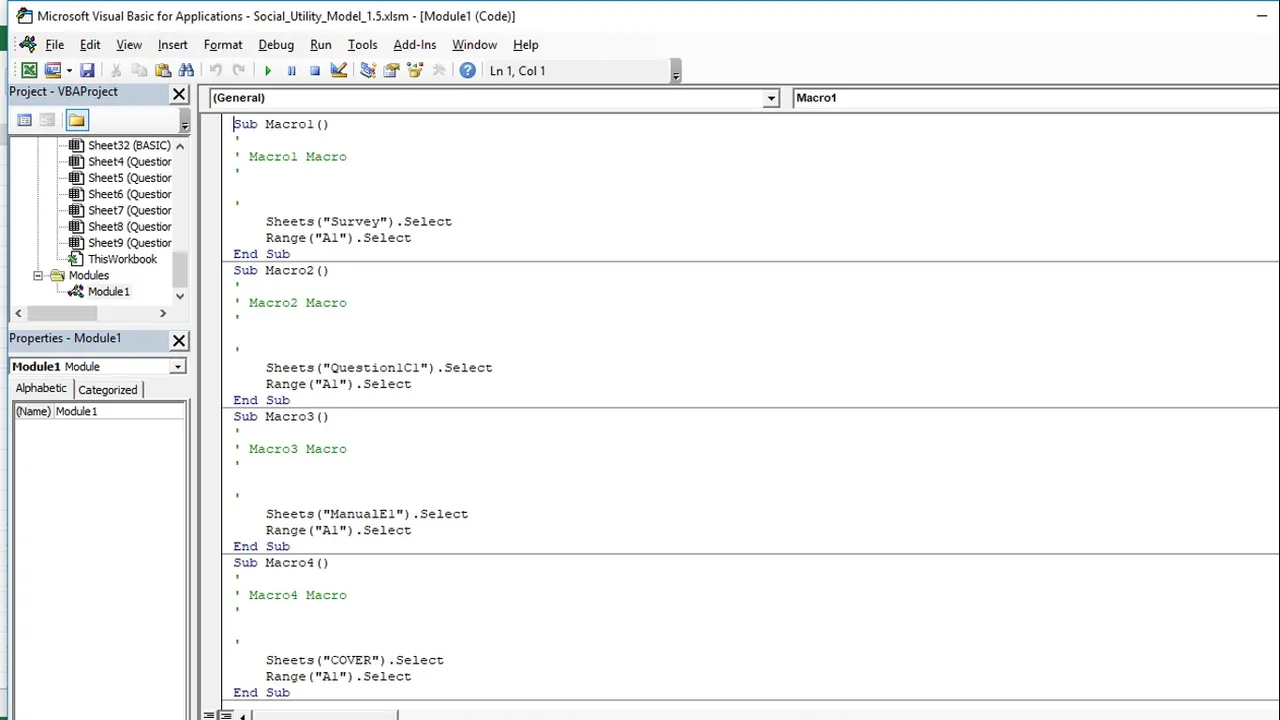
Visual Basic for Applications (VBA) has been used to create macros that enable users to move easily between worksheets/pages. You should notice from the screenshots that the pages of the models contain button. These buttons allow users to move between worksheets/pages. As this is a Microsoft Excel-based model, users can also unhide tabs, which can also be used to navigate the model.
Conclusion

This post should provide a general overview of how the ‘Economic Social Utility Analysis’ model operates. I will be making a video that will further demonstrate how this model operates and can be used.
Thank you for taking the time to read this post.
Post Beneficiaries
The beneficiaries of this post based on the top three upvotes of the previous post are:
Each beneficiary will receive 20% of the post payout. Thanks for your support.
A fourth beneficiary has not been added because of the lack of engaging comments in the previous post. The previous post was quite technical so I can understand if my usual audience found the content to be a little difficult to provide engaging comments.
To learn more about post beneficiaries you can read my post using the following link.
