Warning: This post is reasonably technical. To fully understand this post the readers should have some knowledge of the concepts of utility as well as demand and supply. Links to my other posts relating to utility, and demand and supply are provided at the end of this post.
Today I will be taking a look at indifference curves. The term sounds rather sophisticated but the concept should not be too difficult to grasp. Indifference curves are used to help explain purchasing behaviour. Indifference curves along with several other concepts are a part of consumer theory. Consumer theory is broad and covers many concepts that attempt to explain human decision-making in relation to expenditure decisions. Knowledge of indifference curves is important to understand human decision-making as well as how we can improve our own decision-making process.
What are indifference curves?
An indifference curve is a curve that contains all the combinations of goods and services that yield the same level of satisfaction (utility). For ease of understanding, indifference curves are typically presented as combinations of two goods that yield the same utility.
Indifference Curve
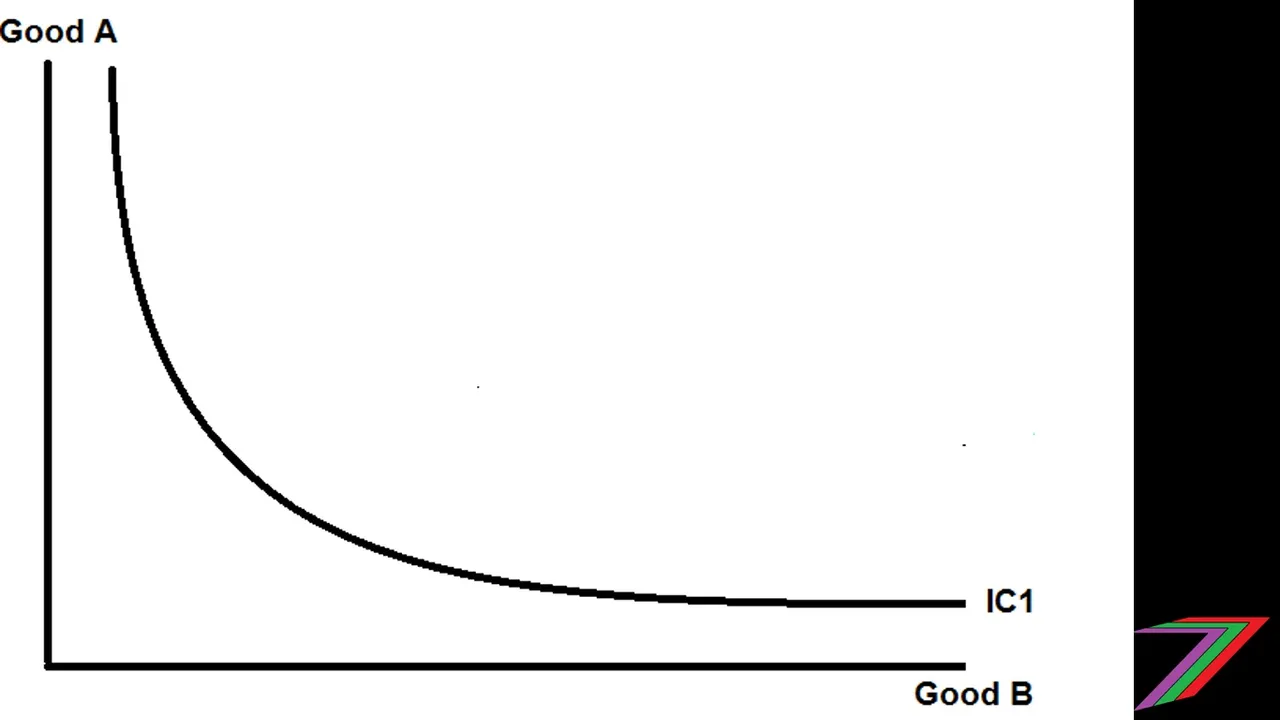
Note: IC1 = Indifference Curve 1
Shape of the indifference curve
The indifference curve in the diagram is convex to the origin. This is how indifference curves are typically drawn. The shape is caused partly because of diminishing marginal utility. Diminishing marginal utility basically implies that the more you have of something the less you want. The tightness of the curve demonstrates the extent of the relative diminishing marginal utility of each good. The diagram below shows three indifference curves with different degrees of curvature.
Different Shaped Indifference Curves
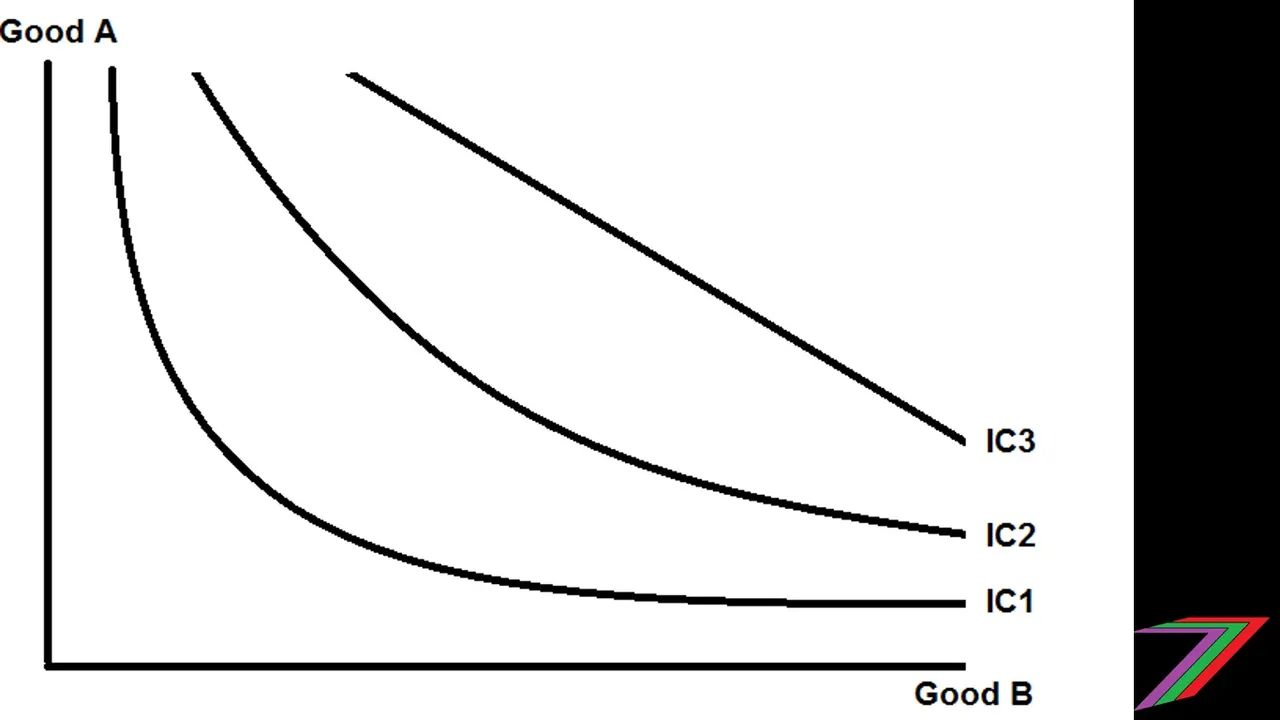
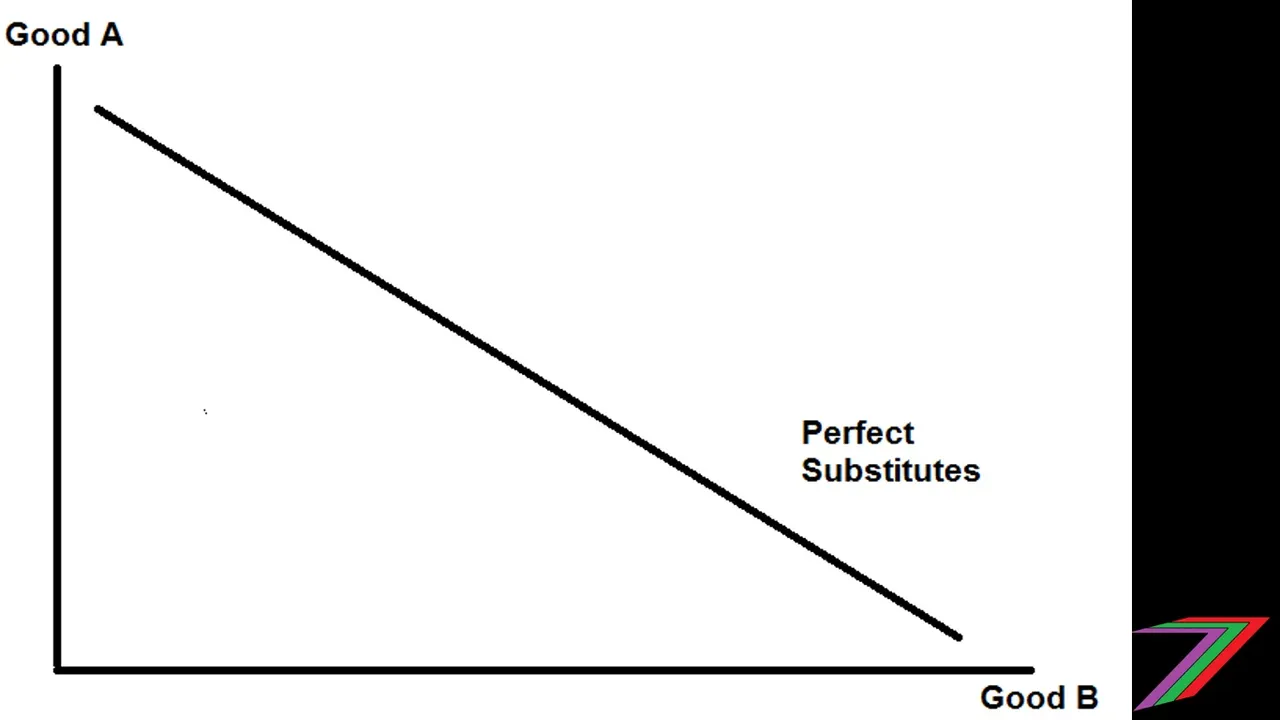
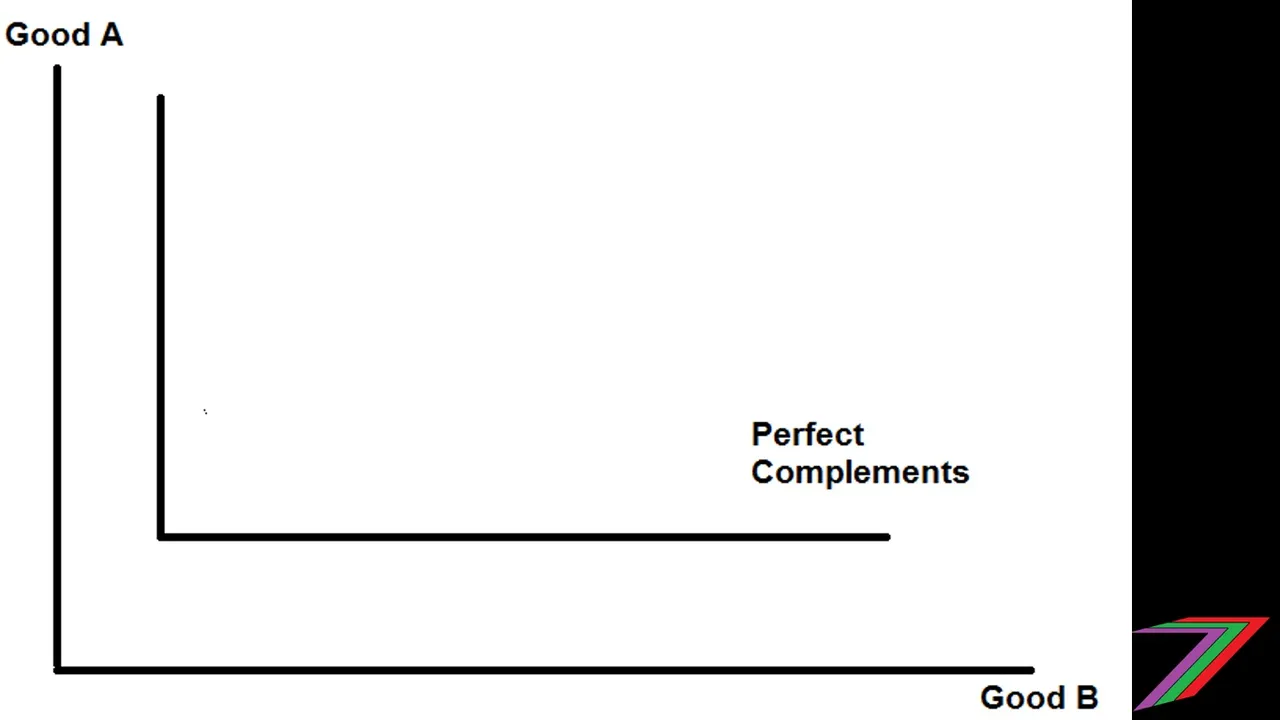
The shape of the indifference curve will also vary depending on the relationship between the goods being compared with each other. If the goods are substitutes, the indifference curves will be less curved. If the goods are complements, the indifference curves will be more curved. If the goods are perfect substitutes, the indifference curves will be straight lines. If the goods are perfect complements, the indifference curves will form the shape of the letter ‘L’.
Perfect Substitutes
Perfect Complements
Substitute goods are either very similar in nature or address very similar needs or wants. For example, drinking a glass of Coca-Cola after drinking a glass of Pepsi is not much different than drinking another glass of Pepsi. Utility gained from the Coca-Cola has already diminished because of the glass of Pepsi consumed beforehand.

Complementary goods enhance each other. Therefore, we can obtain the most utility by consuming them together in particular quantities. For example, left shoes and right shoes are perfect complements to each other. They are always used together. A person would gain the same level of utility from 10 left shoes and one right shoes as he would from one left shoe and one right shoe. Hence, this is why we have the ‘L’ shaped indifference curve for perfect complements.

Budget constraints
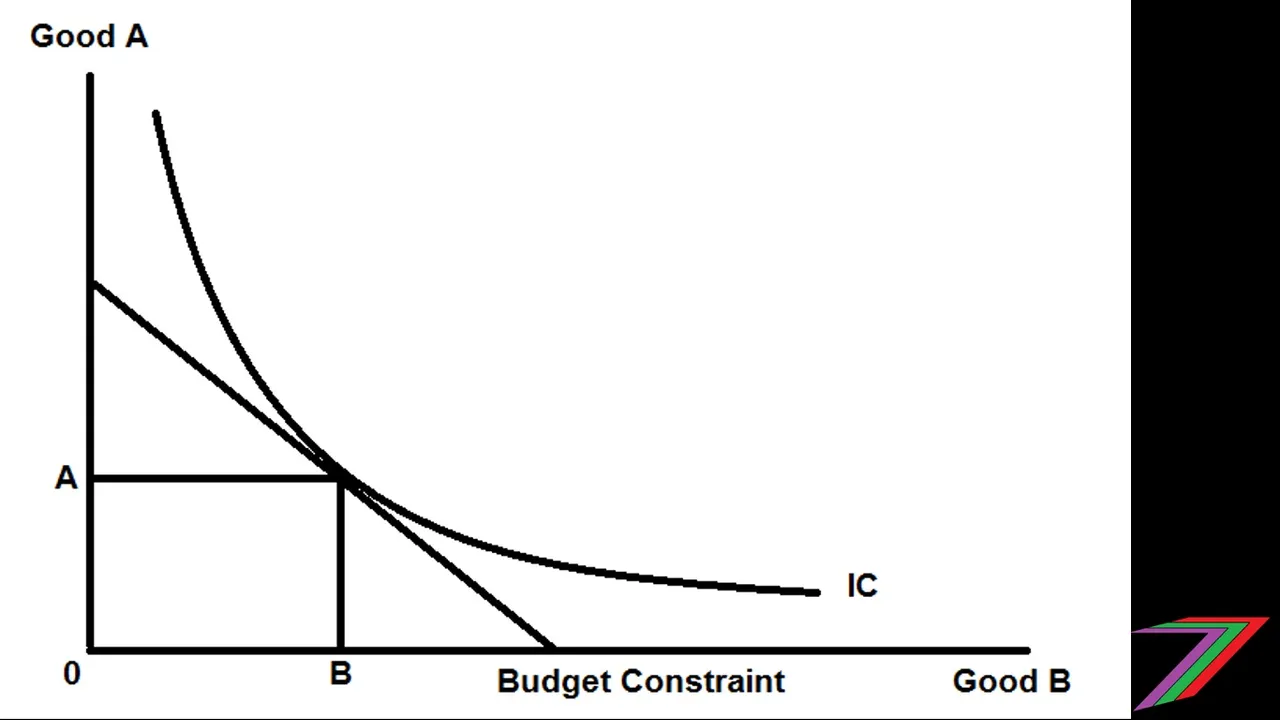
Indifference curves are used with budget constraints to determine a person’s demand for particular goods and services. The optimal quantities demanded for each good or service can be determined at the point where the budget constraint runs tangent to an indifference curve. This is the point that a person achieves his or her maximum utility. This indifference curve has the highest value of utility of any indifference curve that is within that person’s budget.
Indifference Curve and Budget Constraint
Price Effect
The price effect is the effect that a change in price has on the quantity demanded of a good or service. The price effect consists of a substitution effect and an income effect. The substitution effect, is the effect that the relative change in prices has on quantity demanded in the absence of any changes in real income. The income effect, is the effect that real income has on quantity demanded for a good or service.
Substitution and income effects can be demonstrated using indifference curves and budget constraints. To demonstrate a price reduction in one good, the budget constraint pivots outwards. This is to show that more of the good can be obtained with the same budget. The new budget constraint will run tangent to another indifference curve (IC2 in the diagram). This indifference curve will have a higher utility. To obtain the substitution and income effect, a hypothetical budget constraint running parallel to the new budget constraint but tangent to the initial indifference curve (IC1 in the diagram) needs to be constructed. See diagram below.
Price Effect (Substitution Effect and Income Effect)
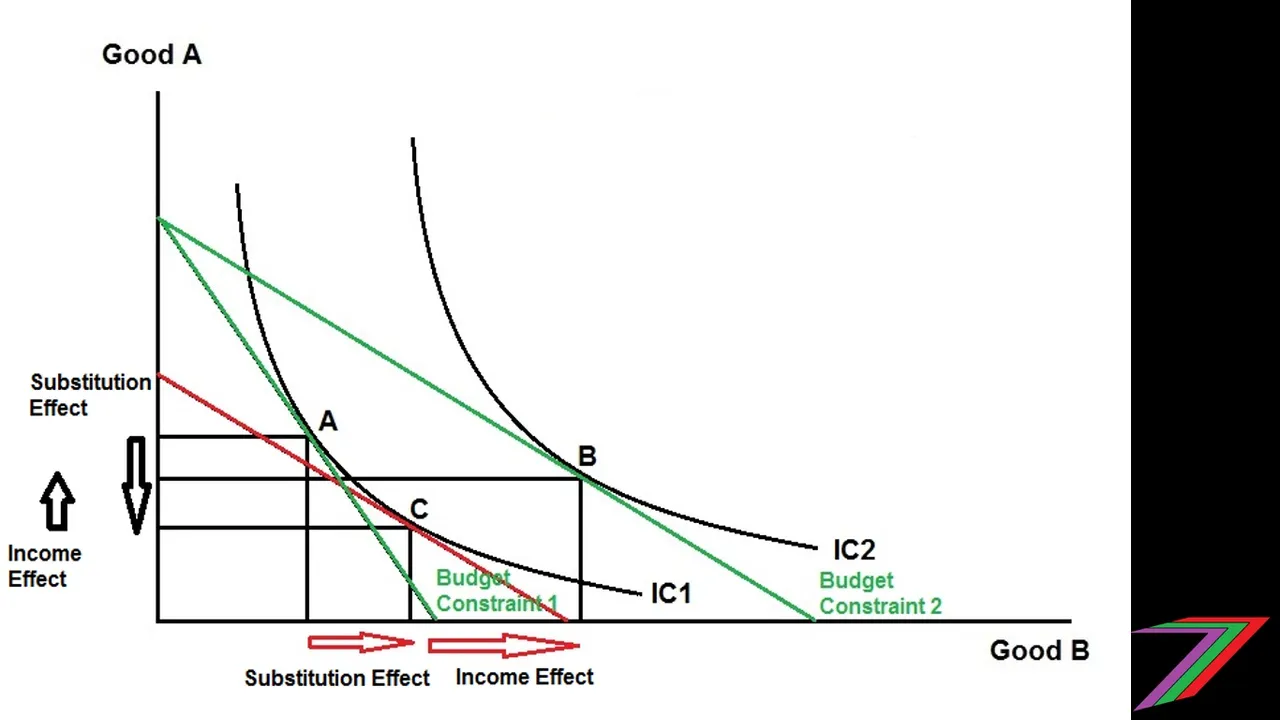
The substitution effect is the change in quantity demanded of Good B between the initial point at A and the new point at C along the initial indifference curve (IC1). Any price fall will always result in a positive substitution effect. The income effect is the change in quantity demanded of Good B between Point C and Point B. The income effect is positive for normal goods and negative for inferior goods. Overall change in quantity demanded is called the price effect (Price Effect = Substitution Effect + Income Effect).
Why is it important to understand indifference curves?
Our choices are not presented in the form of indifferences curves. We do not know the exact level of satisfaction that we can obtain from every possible combination of goods and services. What we can learn from indifference curves is that certain combinations of goods and services can gives us more value, satisfaction, and utility. Accumulating too much of one thing will likely gives us less value or satisfaction.
The theory behind the use of indifference curves does not have to be restricted to buying goods and services. The theory can be used to analyse any preferences. The constraint need not necessarily be a monetary constraint. It could be a time constraint.
Other related posts
For more information regarding demand, supply and equilibrium, you can read my Steemit blog using the following link:
You can also watch my demand and supply video on Dtube using the following link:

For more information on utility, you can read my Steemit blog using the following link: