Technical trading continued in earnest in the cryptocurrency segment, as the dominant downtrend briefly carried Bitcoin below the widely watched $10,000 level which was followed by a sharp snapback rally. As correlations between the major coins remained very high, altcoins tracked the movements of BTC closely, still pointing to a nervous and bearish sentiment in the sector.

BTC breached the key $11,300 support/resistance level during the bounce, but despite that, the short-and long-term setups remain negative and we still expect at least a test of the prior correction low near $9000. Further strong zones are found at $8200 and $7650, and as the sell-off already cleared the long-term overbought readings, investors could accumulate BTC near the main support levels

BTC/USD, 4-Hour Chart Analysis
Ethereum continues to hover around the $1000 level, as volatility in the coin remains lower. The price of the ETH token is in a short-term downtrend, while the long-term momentum is overbought. Traders and investors should wait for the correction to clear the overbought readings before entering new positions. We expect new lows in the coming weeks, with key support zones still found near $850, $740, $625, and $575, and resistance ahead at $1175.
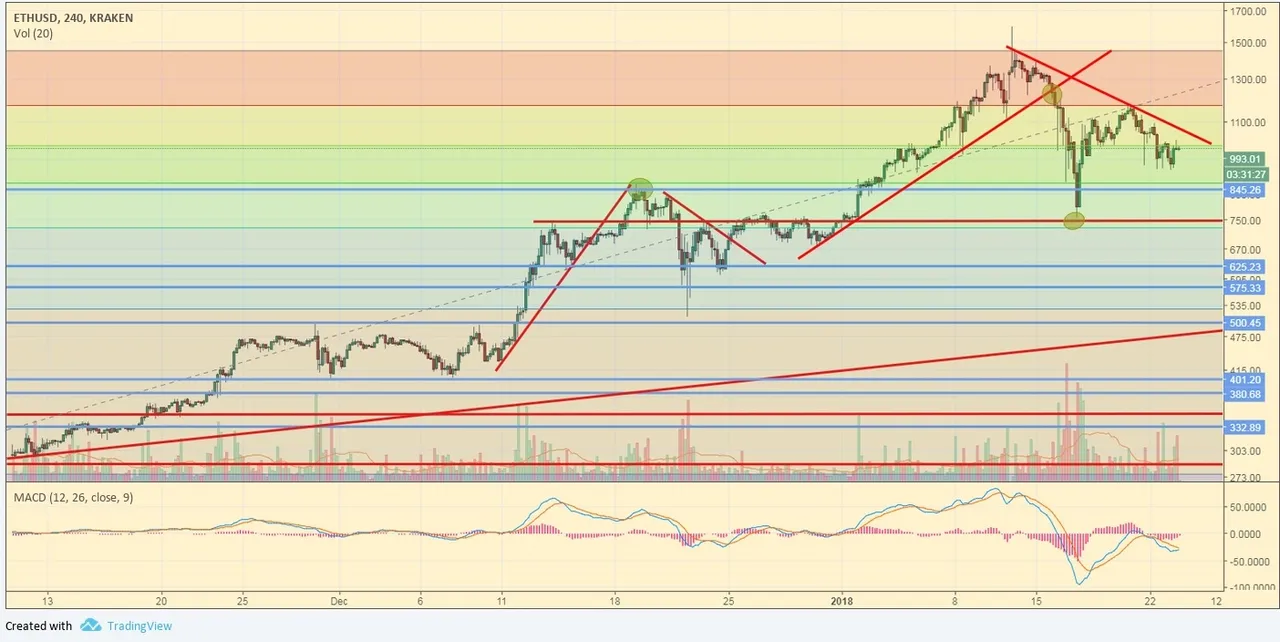
ETH/USD, 4-Hour Chart Analysis
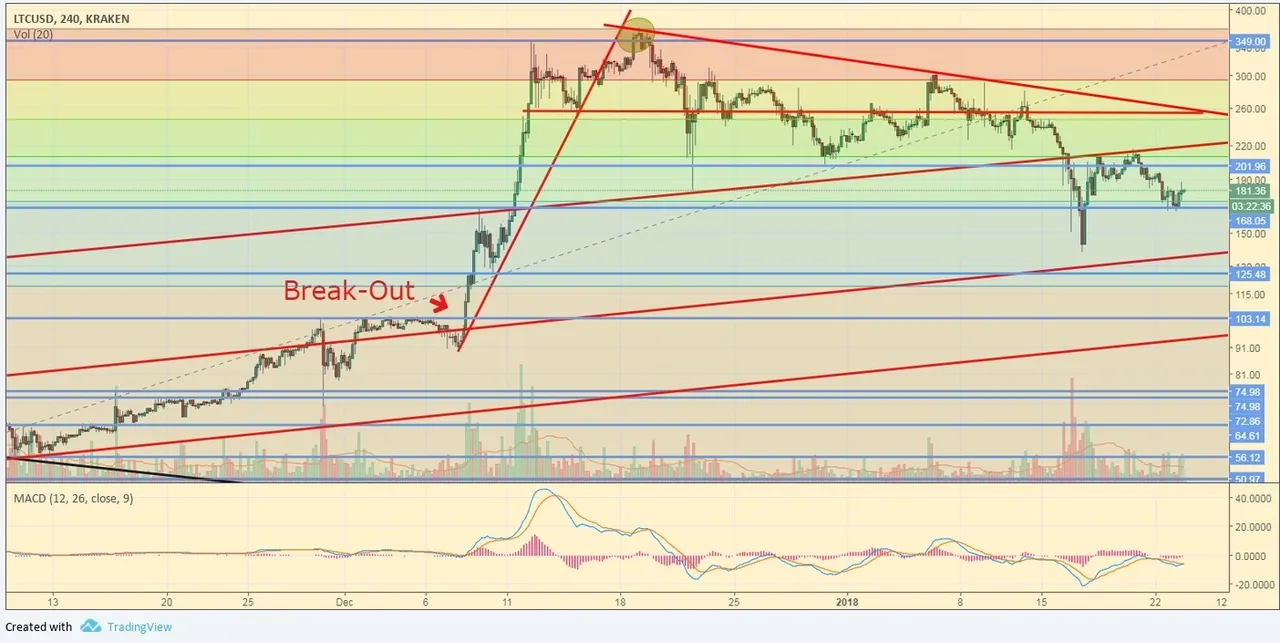
LTC/USD, Daily Chart Analysis
Litecoin bounced off the $170 support yesterday and today as well, but the counter-trend move seems weak and a dip towards the crash lows is likely in the coming days. Below that, key support is found at $125 and $100, and while we still expect the correction to continue, investors could already add to their holdings near those levels.

DASH/USD, 4-Hour Chart Analysis
Dash is trading below the key support/resistance zone around the $825 level, as the coin has been moving in line with the trends in the broader market. We still expect a re-test of the crash low soon, with a possible new low before the end of the current cycle. Further key levels are found at $500 and $400, with the rising long-term trendline just below the $500 price level.

XRP/USD, 4-Hour Chart Analysis
Ripple is stuck between the declining trendline and the $1.25 level for now after today’s bounce, as the bearish pattern is still dominant. The coin will likely continue to trend lower from the current levels, although a final low might already be in, and investors could still add to their holdings on the short-term sell-offs near the main support levels at $1, $0.85, with primary resistance ahead at $1.5.

ETC/USD, 4-Hour Chart Analysis
Ethereum Classic is hovering just below the $30 level, showing some relative strength amid the broad correction. While the short-term setup remains bearish, and traders shouldn’t open new positions here, investors could be looking for entry points near the major support levels at $25 and $23, with further strong support found at $18, and resistance ahead at $34.

XMR/USD, 4-Hour Chart Analysis
Monero recovered above $300 during the bounce today, but the coin’s relative strength that we observed last week is gone, and the bearish long-term setup remained dominant. As we still expect a re-test of the lows, with a possible dip to $200, traders shouldn’t open new positions here, but investors could accumulate XMR near the main support levels.
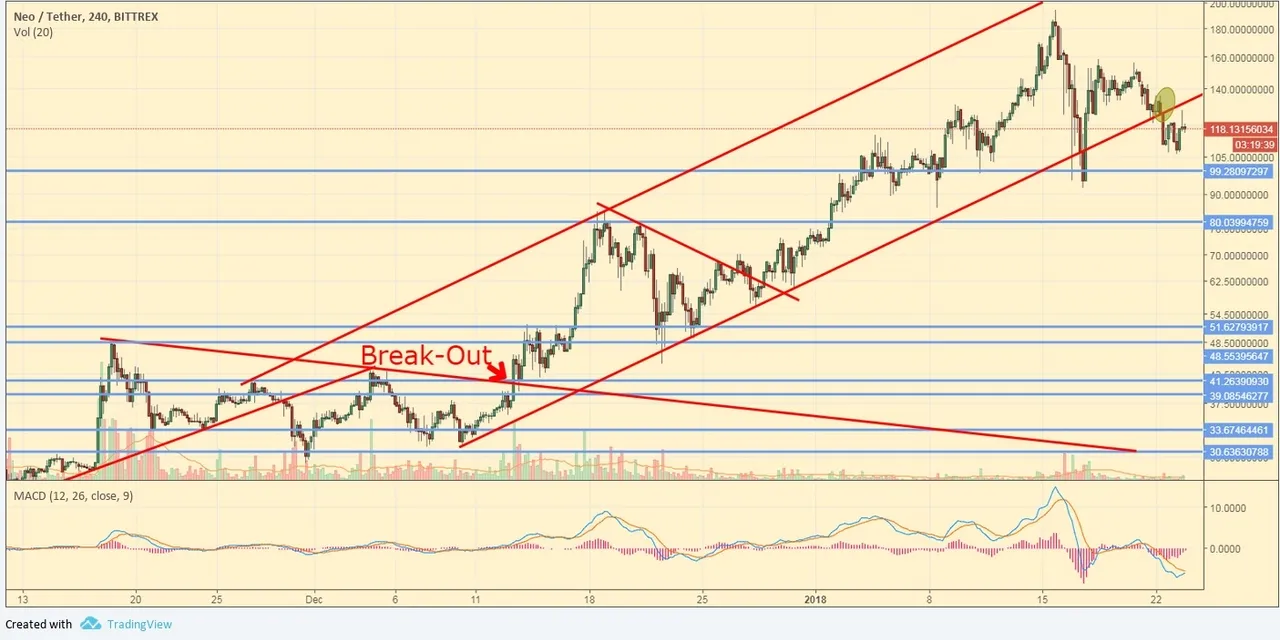
NEO/USDT, 4-Hour Chart Analysis
NEO, the late leader of the prior rally in the segment, now trades in a short-term downtrend, and given the overbought long-term momentum readings, a deeper correction is likely underway. A dip below the crucial $100 level is expected in the coming week, with further support levels found at $80, $64, and $56.

OTA/USD, 4-Hour Chart Analysis
IOTA followed the majors slightly higher today, as the coin continues to trade in the lengthy correction pattern that developed after the exponential surge in December. The currency is likely headed for a re-test of the lows just below $2, with a possible dip to $1.5, although a relatively early bottom could be ahead and investors could look for entry points near the main support levels.