
NEOUSD
Looking at NEO with a swing traders setup while alt coins are up today as BTCUSD broke 8k.
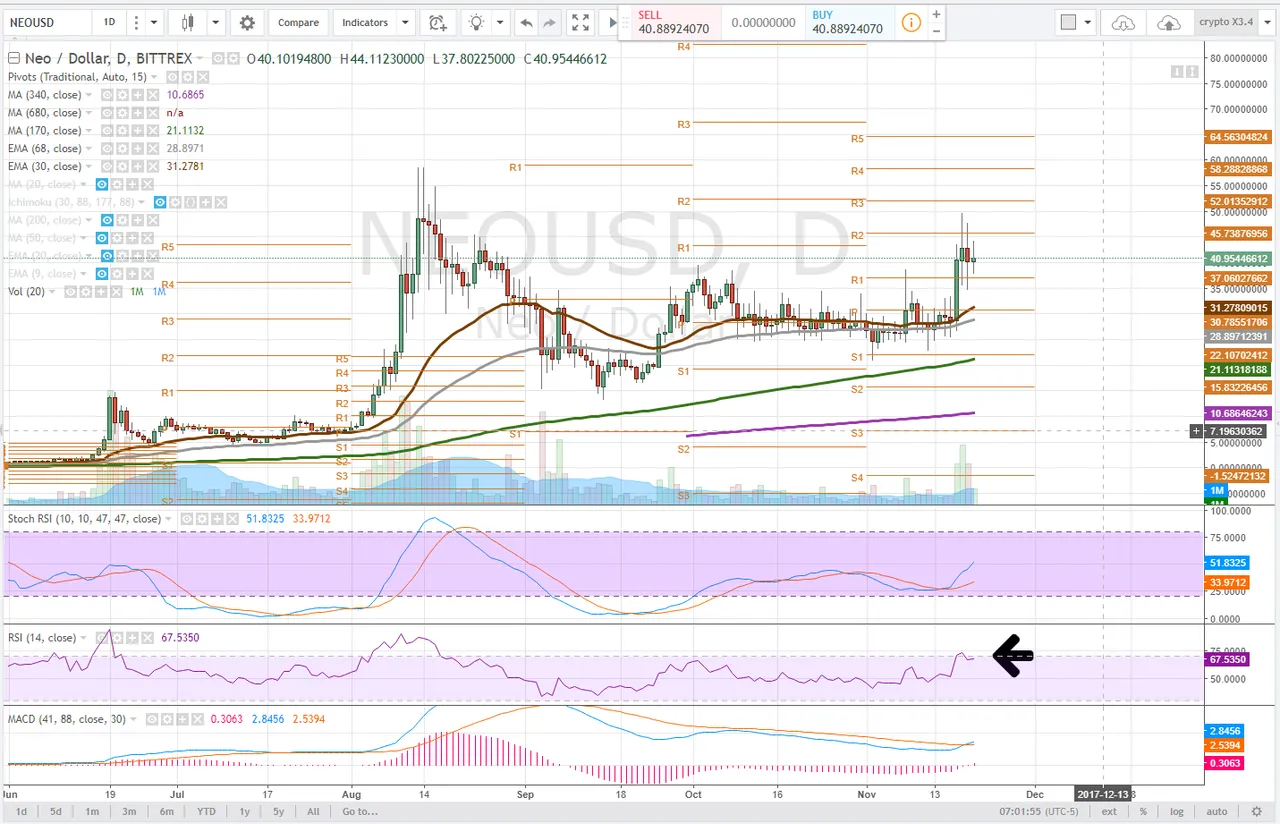
Daily
NEO had a bit of a run, appreciating nearly 50% before a phase of consolidation began. If we missed the move, we don't chase, we look for an entry opportunity and learn our levels. It doesn't appear the dip is over but on the daily time frame we can make note of several signs of price progression.
For starters, the price has moved above the moving averages and has so far managed o stay above pivot support R1, $37. Its important for the price to hold this level or a trip to the 30ema (brown) is in store. The 30ema has converged with the pivot and so we look for the low $30 range as a must hold level for bulls to set a higher low.
The candlestick formation itself is forming what appears to be a bull flag so to the upside bulls need to see the price break above and hold pivot r2, approximately $45.
The stochastic RSI and MACD have just turned up and while the bullish momentum has come to NEO the RSI is close to overbought territory. A trend can be defined and traders will look for the trend in the RSI to hold, pushing it into overbought territory. If the RSI begins to correct the price may as well and that's where we look to enter on a dip using a stoploss to mitigate risk. Conversley if it keeps going, we look to add to or start a position on bull flag breakout confirmation.
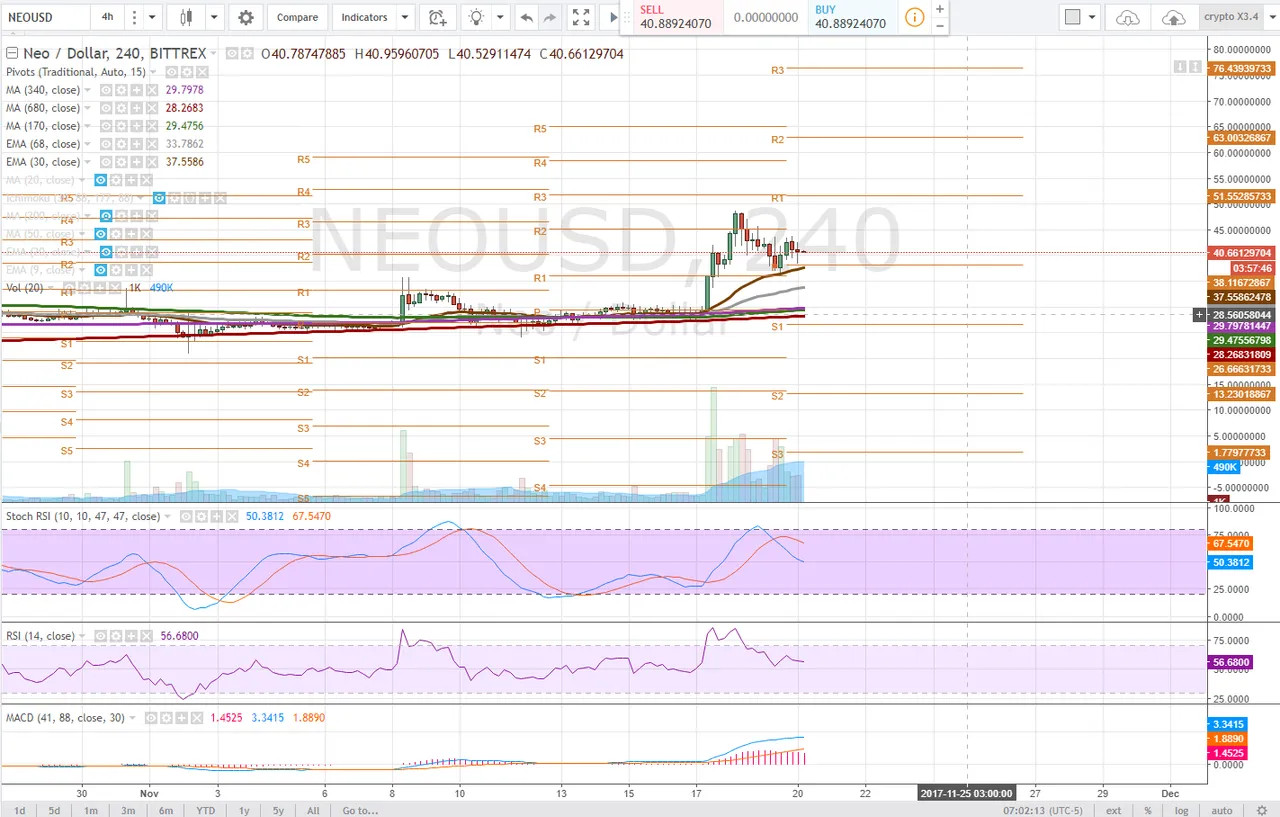
4 hour
The 4 hour time frame has shown the price consolidating back towards a pivot support as the price stabilizes after such an extreme move. The stochastic RSI has already begun correcting dragging the MACD down towards a bearish curl, tho no bearish cross has occurred. The RSI is trending sideways and indicates selling pressure has not yet hit.
The candlestick formation can be viewed as a head and shoulders pattern with the neckline at approximately $36 - this is a must hold level, and aligns with the 30ema and 4 hour pivot support. These areas are crucial for bulls to hold or the price could slip lower to the 68ema, grey, approximately $28.
Not the convergence of longer period moving averages where the price of NEO took off from, traders will like to see the 170dma (green) pull, conducive to a longer term bullish trend, if the price can find support here and bounce.
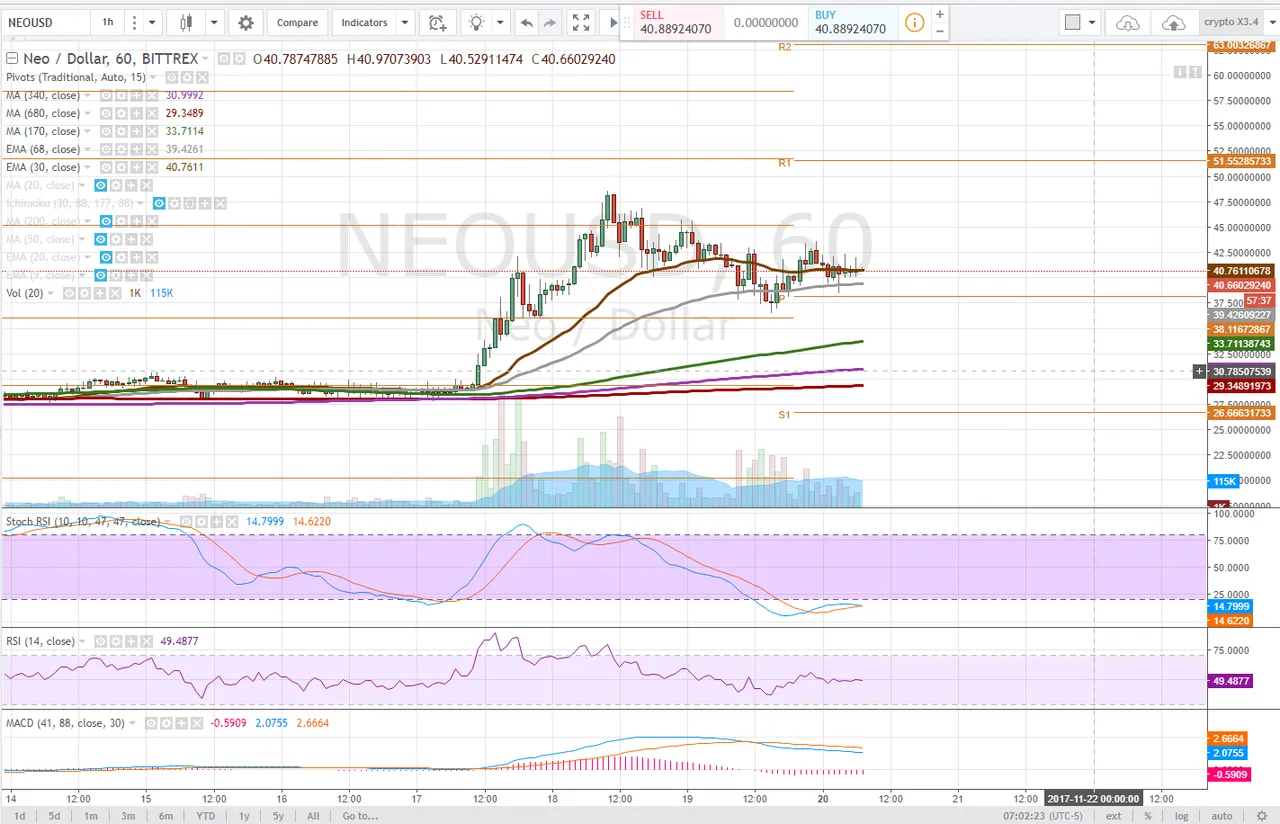
1 hour
The sotchastic RSI on the 1 hour time frame has already cycled into downtrend with the MACD heading for the zero line. This is something those looking to enter a position should watch for as if the MACD (the momentum behind the price) were to turn up at the zero line we would have a bullish divergence.
The RSI has corrected to the midground and is trending sideways which is neutral.
Bulls need to see the price hold the 30ema on this time frame approximately $40 or we look for support lower as the pivot, $39
Bullish Above: $46
Bearish Below: $35
RISK TRADE: wait until the price tests and bounces off of the 1 hour pivot, approximately $38, set a stop loss, conversely enter a position on bull flag breakout confirmation.
We watch a move like this for entry opportunities or opportunities to short it. We missed the first move but that puts it on our radar for the second. Never chase, wait, plan and have a strategy that will protect you if the chart turns against you. In this case, we are looking to buy off of a support, or on a breakout - looking for the meat of the move.
Don't forget to use stop losses!!!
Previous Articles:
DASHUSD
BTC Vs. BCH
BTCUSD
ETHUSD
BTCUSD
BCHUSD
BTCUSD
ZECUSD
XRPUSD
Follow at your own risk, Not a financial adviser, understand the risks associated with trading and investing. Manage your own Risk - in other words you could lose it all and it's your own fault.