
BCHUSD - Day Traders Chart Setup
Moving averages:
Green = 50dma
Red = 200dma
Orange = 9ema
Black = 20ema
Yesterday we did a quick chart on BTCUSD looking for a relief pop making note of the possibility that the price could slip all the way to $5500, which it has. BCHUSD has been on a tear this whole time as hash rate has migrated over too it and it.
If you would like to monitor this check out - https://fork.lol/pow/hashrate
In 6 hours, bitcoin cash difficulty will retarget, traders and investors should actually be watching to see what happens to the price as this occurs.
I want to chart Bcash today and discourage chasers. Its a token that's been on my radar for some time, I missed this move, but no harm no foul there are always other opportunities. Long story short - DON'T CHASE!
Our analysis for price thresholds in Bitcoin are as follows:
Bullish Above: $6268
Bearish Below: $6000
We will do the same for BCHUSD today.
I am using a day traders chart set up because of the price volatility which could make my longer term, swing trader setup deliver many false signals.
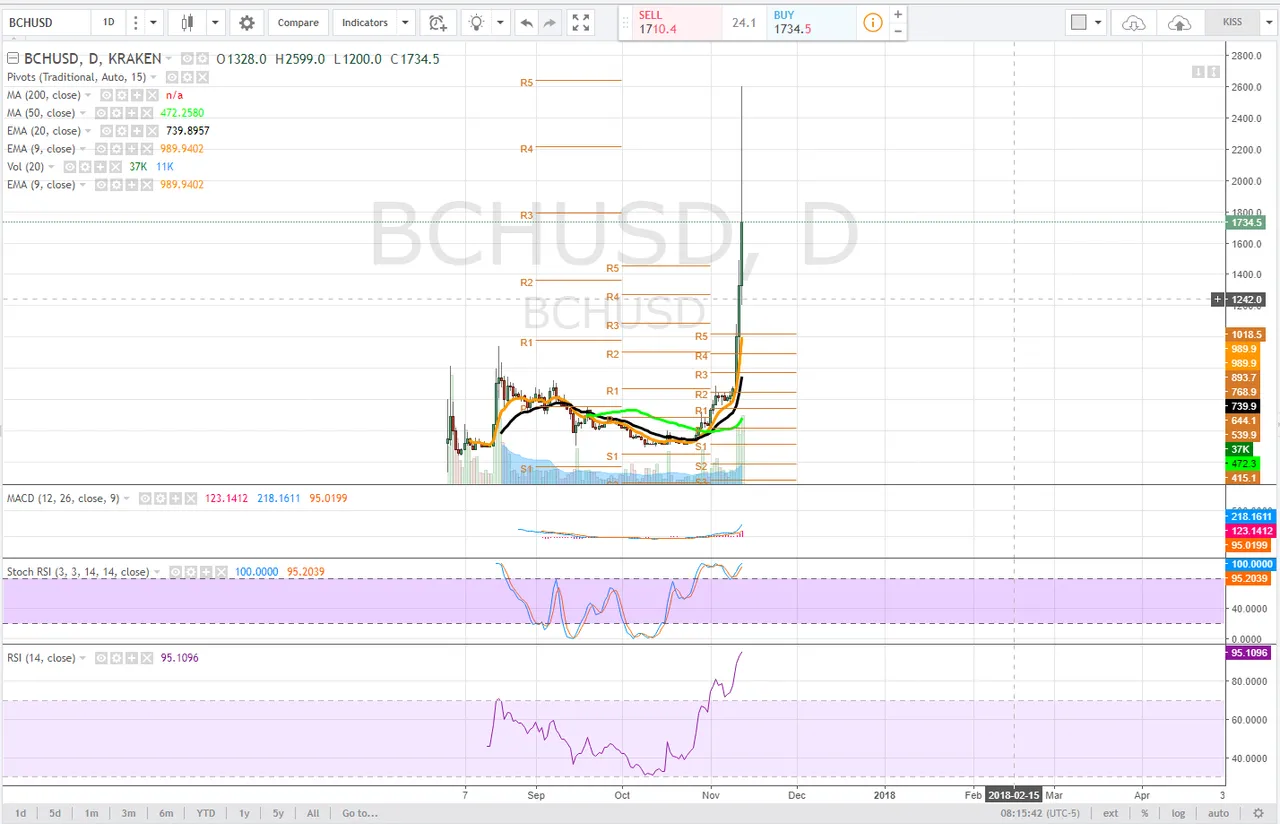
Daily
Still being relatively new there isn't a whole ton of chart data yet, but working with what we got, first we saw the price hit of $2500 and then sell off very hard, falling back down below $2000.
The price has gotten away from our pivot resistances and moving averages and consolidation/pullback should be expected to continue until the price normalizes.
The RSI is extremely overbought and the Stochastic RSI has been in extended uptrend for some time. On the daily time frame if the price must maintain previous weeks pivot r5 $1456 or it will fall back down to meet with the 9 and 20ema.
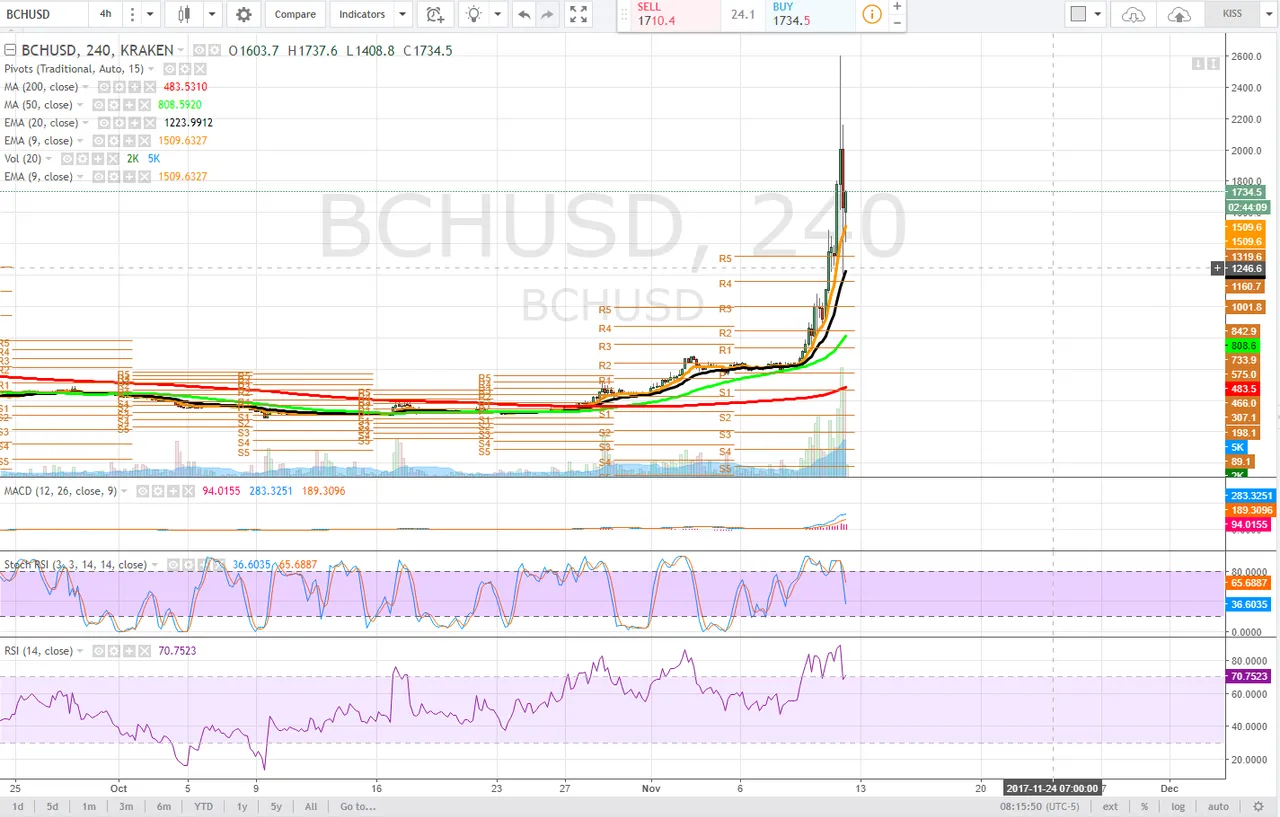
4 hour
On the 4 hour time frame we see the price actually wicked all the way down to the 20ema during the sell off, $1227. The price has yet to print a higher high on this time frame. We watch for the 9ema and 20ema to begin to curl down as the sotchastic RSI has entered a downtrend, causing the MACD to curl. The RSI is extremely overbought on this time frame. It makes taking a position here very risky and something only the skilled and risk tolerant may consider if they were to be looking for scalp opportunities using shorter period time frames like the 5 minute chart.
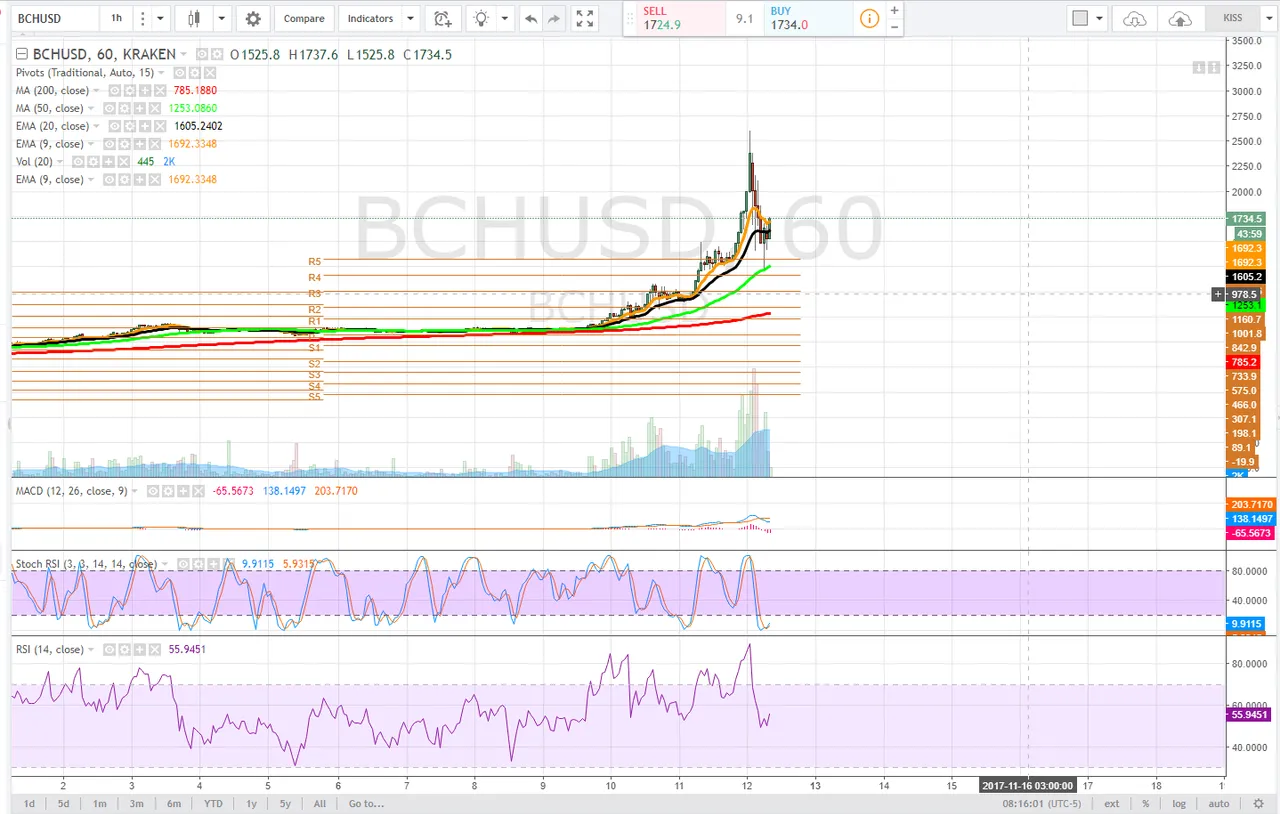
1 hour
On the 1 hour time frame the stochastic has cycled all the way into downtrend as the RSI broke down and the macd delivered a bear cross. The price did wick off of the 50dma and this tells us that that is an area of supply. Currently, the price is trying to push above the 9ema, and it is possible to see it enter range bound consolidation between the 9ema and 20ema.
If the price looses the 20ema a retrace of this move should be expected.
Bullish Above: $2100
Bearish Below: $1600
RISK TRADE: Do nothing, we missed the move. If price reclaims $2100 on volume and is confirmed by a follow-up candle on the 1 hour time frame, maintain a bullish bias, cautiously so, use stops to limit risk. Conversely, if the price loses the 20ema on the 1 hour time frame, expect the pullback to deepen.
Don't forget to use stop losses!!!
Previous Articles:
BTCUSD
ETHUSD
BTCUSD
BCHUSD
ZECUSD
LTCUSD
BTCUSD
ETHUSD
Follow at your own risk, Not a financial adviser, understand the risks associated with trading and investing. Manage your own Risk - in other words you could lose it all and it's your own fault.