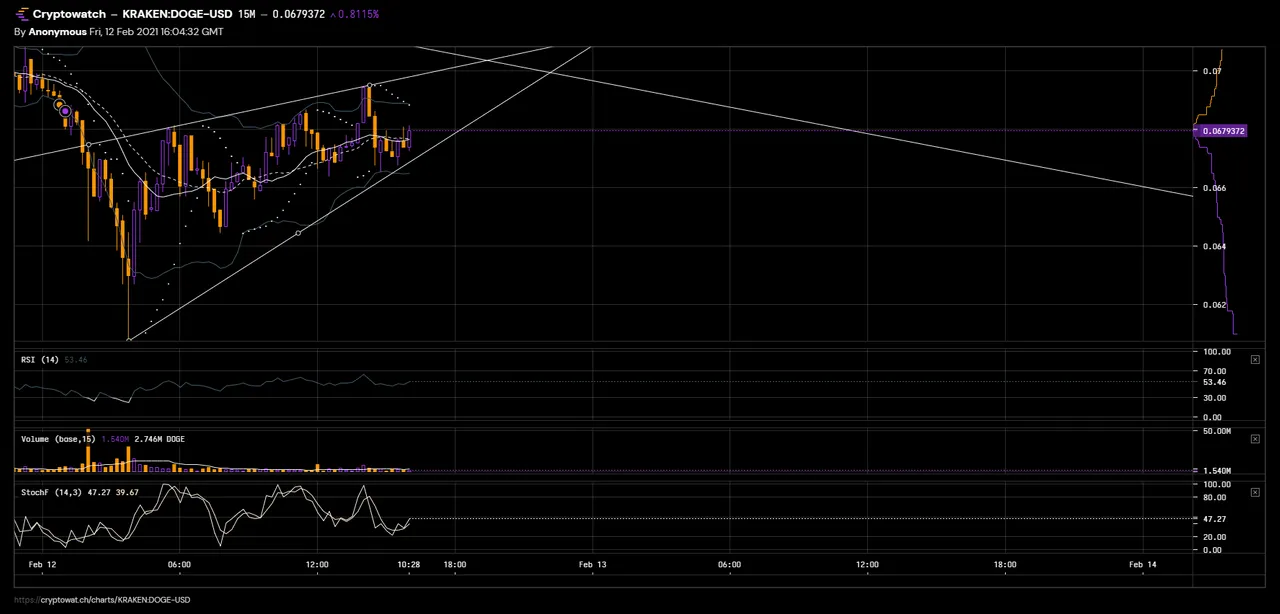
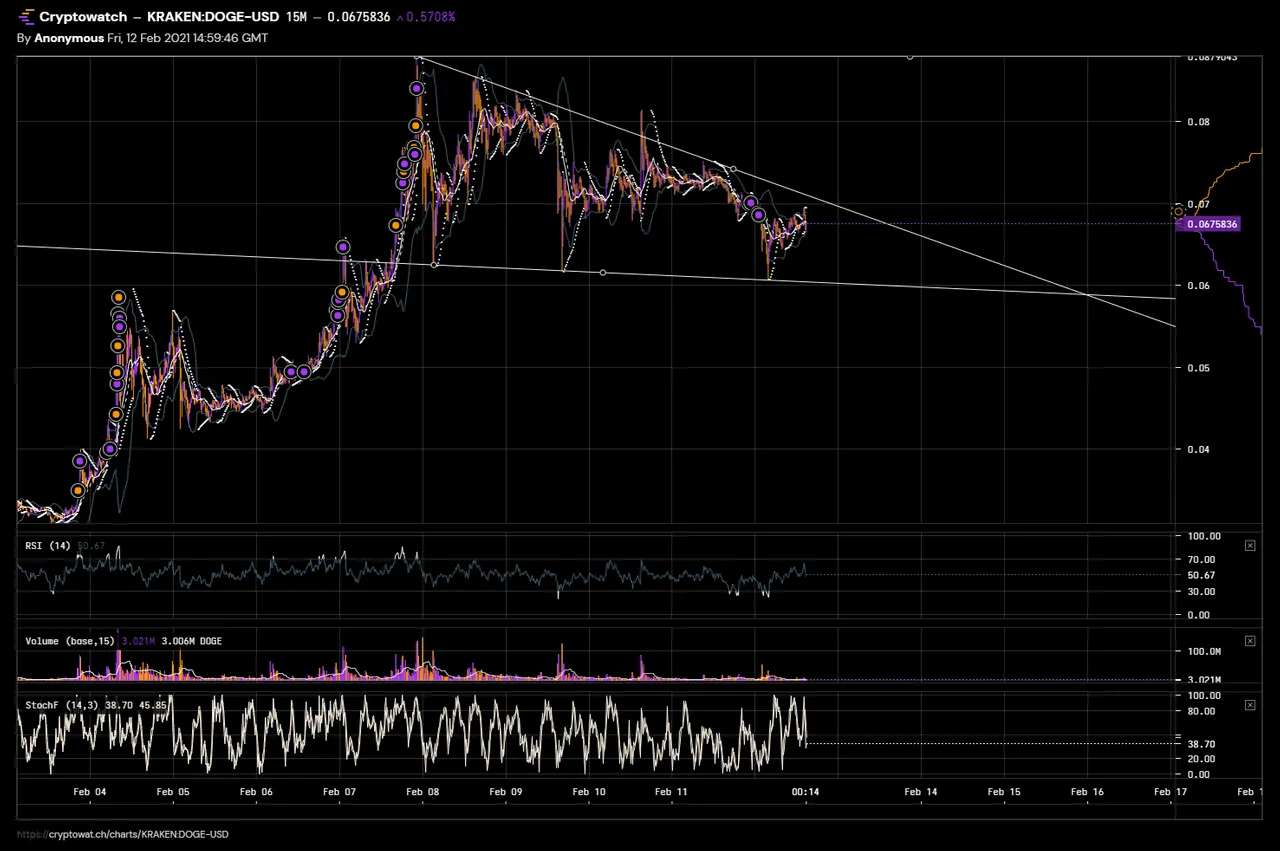
This Is a zoomed out picture of doge since It took off on a 15 chart. It's Either gonna be a bull flag. That's the likeliest scenario. Or break down, and I'd dip If that happened. The next picture shows the 15 min chart now. Which shows doge moving up In an Upward channel trying to push for higher highs as It cooled Itself off a little bit throughout the past 24 to come down on the daily/weekly charts.
If you have any questions about the indicators used feel free to ask. Stochastic RSI Fast Is extremely useful. So Is parabolic SAR given the state of this crypto. You will see It as a dotted line above or below depending on the trend. When It switch's that's probably a sell. Since doge stays out of the bollinger bands that act as a normal distribution of two standard deviations making a move above or below very unlikely. So when you see It move outside for to long It's usually an indicator of where the market's headed. Unless you have fundamental stuff going on like doge or btc and just go parabolic.