
Bitcoin price continues teetering on the edge of a precipice. A valiant effort to escape gravity, late on Sunday, has only seen price slump back toward $650. Unless the buyers capitulate, a large decline seems inevitable.This analysis is provided by xbt.social with a 3-hour delay. Read the full analysis here. If you are new to trading or unfamiliar with the concepts and analysis tools used below, subscribe to xbt.social to learn the ropes.
Bitcoin Price Analysis
Time of analysis: 15h00 UTC
Bitstamp 1-Hour and 1-Day Candle Charts
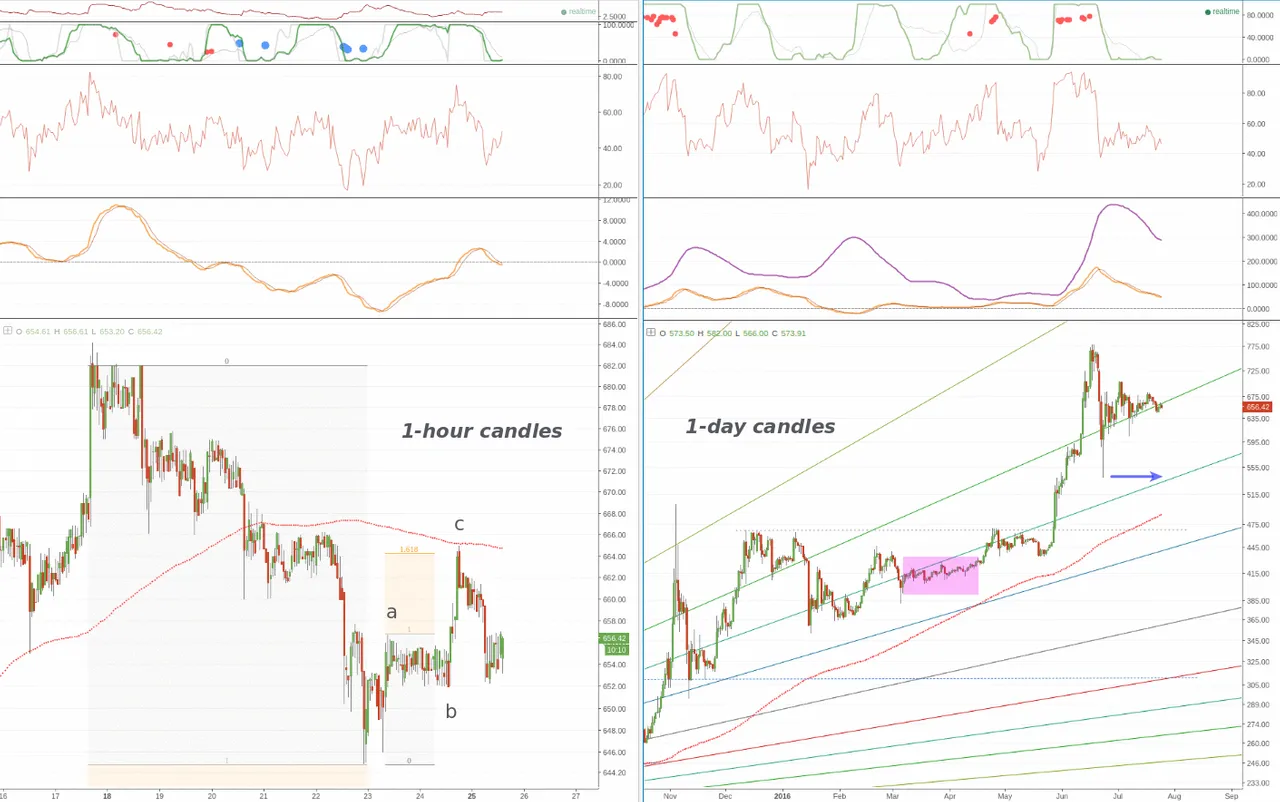
From the analysis pages of xbt.social, earlier today:An ABC corrective pattern was anticipated in yesterday’s analysis:If this wave count is correct, then we’d expect the wave C to target the 1.618 Fib extension of wave A at $664. This will also be the approximate level of the 1hr 200MA, as well as a 50% retracement of the decline since 18 July.The C wave did indeed target the 200MA across exchange charts and reached $665 in the Bitstamp chart before reversing (1hr chart, left).From the current juncture, the decline implied by the 4-hour chart (not shown) and 1-day candle chart (right) can resume.The 4-hour candle chart’s MACD, earlier today, crossed below its signal line while below zero. Meanwhile, in the 1-day candle chart (right), MACD has consistently held below its signal line since the June wave top. The present daily candle is critical for trend: it is below a Fib line that had seen strong downside unfold when correcting patterns closed a daily candle below it on two previous occasions.However, today’s daily candle has not yet closed and bullish conviction can close it above the Fib and potentially neutralize all of the large timeframe bearish signals. In this case it is conceivable that the market maintains strain against decline until a gradual rising wave is achieved – as was, perhaps miraculously, managed earlier this year in the magenta rectangle.
By failing to prepare, you are preparing to fail. – Benjamin Franklin
Summary
Bitcoin price has returned to the weekend’s lows. Although we would like to see bitcoin price continue advancing indefinitely, this is not how commodity prices are speculated by markets. Price expansion and contraction is both inevitable and healthy for any market. Various technical factors have compounded to bring the bitcoin price chart to a bearish juncture and a large decline remains highly probable.
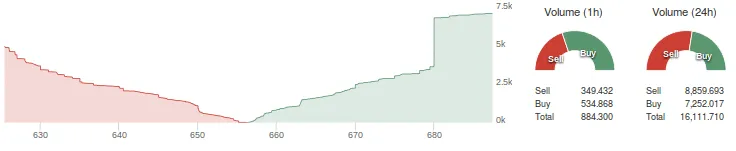
Bitfinex Depth Chart and Buy/Sell Volume
Click here for the CCN.LA interactive bitcoin-price chart.
What do readers think? Please comment below.This analysis is provided by xbt.social with a 3-hour delay. Read the full analysis here. Not a member? Join now and receive a $29 discount using the code CCN29.Readers can follow Bitcoin price analysis updates every day on CCN.LA. A Global Economic Outlook report is published every Monday.DisclaimerThe writer trades Bitcoin. Trade and Investment is risky. CCN.LA accepts no liability for losses incurred as a result of anything written in this Bitcoin price analysis report.Bitcoin price charts from TradingView.
Image from Shutterstock.