Is there any pattern to mortality, or do people just die randomly throughout the year? To answer this question, we need to take a look at excess mortality over a period of several years. For this, we will use data from EuroMOMO, the European Mortality Monitoring Project, which collects its data from official government sources in twenty-nine participating countries or regions.
EuroMOMO’s data are given in terms of z-scores, a statistical measure of how far the mortality for a given week was above or below the overall mean.
Mean: The average mortality per week per population. This is the total all-cause mortality over a lengthy period of time divided by the number of weeks in that period and normalized for population (ie corrected to take into account changes in overall population). It is often expressed as a death rate—the number of deaths per 1000 population per annum—from which the mean weekly death toll can be estimated.
z-score: The number of standard deviations above or below the mean.
EuroMOMO uses a Poisson distribution to model excess mortality. In a Poisson distribution, the standard deviation is equal to the square root of the mean. According to the CIA Factbook:
The Republic of Ireland’s current population is approximately 5.2 million.
The annual death rate is estimated to be 6.72 deaths per 1000 population. In other words, there are approximately 35,000 deaths each year (6.72 x 5200 = 34944), or 670 deaths per week (34944 ÷ 52 = 672).
In the Poisson distribution for the Republic’s excess mortality, therefore, one standard deviation is 26 deaths (√672 = 25.92). A z-score of +5 means that in that week the number of deaths was approximately 130 above the mean—an increase of almost 20%.
For Northern Ireland, the corresponding data are:
Northern Ireland’s current population is approximately 1.98 million.
The annual death rate (for the UK as a whole) is estimated to be 9.41 deaths per 1000 population. In other words, there are approximately 18,650 deaths each year (9.41 x 1980 = 18632), or 360 deaths per week (18632 ÷ 52 = 358).
In the Poisson distribution for the North’s excess mortality, therefore, one standard deviation is 19 deaths. A z-score of +5 means that in that week the number of deaths was approximately 95 above the mean—an increase of over 26%.
These statistical details, however, need not concern us at this point, as we are only interested in seeing whether there is any long-term pattern to the data. Only the overall shape of the graph is significant. Let’s look first at excess mortality in the Republic in the years leading up to the onset of the Covid-19 pandemic:

As you can see, there is indeed a repeating pattern. Although the graph is continually rising and falling, there is always a low-point around week 44-50 (late October through mid-December), after which mortality rises to an annual high in January. This is the familiar winter burden:
This regular and seasonal “excess” mortality, or winter burden, has been an epidemiological challenge to understand, although, starting with Farr, many epidemiologists originally attributed it almost entirely to the seasonal influenza-like viral respiratory diseases. (Rancourt 5)
What actually causes this seasonality is a subject for a later article. For now, let us just accept that it has been a regular part of our all-cause mortality statistics for decades—if not for centuries. Note also that the low point in excess mortality immediately before the onset of the winter burden is sometimes the annual minimum (eg 2016), but not always (eg 2019). It is as though all but one of the factors associated with midwinter actually favour low mortality—the single exception being the factor that triggers the winter burden.
Now let us look at EuroMOMO’s data for Ireland’s mortality z-scores for the period after the onset of the first wave of Covid-19:
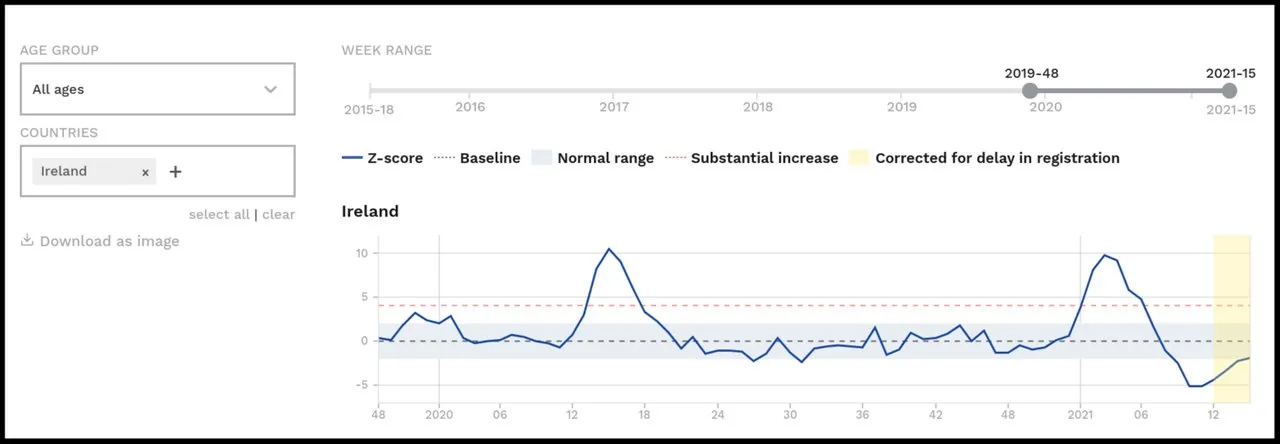
As you can see, the usual pattern was interrupted in the early part of 2020. The bump in mortality in late December and in January due to the winter burden was present but it was much less pronounced than the bump experienced in some recent years. At its peak its z-score was only 3.23, compared to values of 5.85 and 5.77 for January 2017 and January 2018. But this is not unusual. In January 2016 the peak was only 2.99, and in January 2019 it was only 2.41. Note also, that the 2019-2020 winter burden was bimodal. That is to say, it had two peaks—3.23 in Week 51 in December and 2.84 in Week 2 in January. But this is not unusual. In fact, it was also the case with the less pronounced peaks in 2015-16 and 2018-19.
The most obvious disruption of the annual pattern of mortality in 2020 is represented by the sharp peak in April. This was the first wave of Covid-19. The second wave of Covid-19 was also characterized by a sharp peak, but this time it occurred in late December and in January—exactly where the winter burden usually occurs.
At first glance, the Covid peaks do not look at all like the usual bumps due to the winter burden. They are both taller and narrower than the usual influenza peaks. And they are sharp, unimodal spikes. They rise steeply and without a break to a single peak, and then fall precipitously—again without a break—to a low point. This is quite unlike the jittery pattern of the usual winter-burden. Note also that each of the Covid waves was followed immediately by a significant trough of lower-than-average mortality—a feature not usually associated with the winter burden.
These curious features are particularly obvious when we include both periods (pre-Covid and post-Covid) in the same graph:

All of these features will require close examination. Do they support the widely reported claim that influenza has disappeared from Ireland and been replaced by a new respiratory contagion? They certainly seem to give the lie to the alternative claim that the flu has simply been rebranded as Covid-19 and flu deaths are being passed off as “Covid related” deaths. If that were the case, we would expect the Covid peaks to closely resemble the peaks associated with the usual winter burden.
On the other hand, the winter burden has never before been accompanied by such measures as lockdown, social distancing, mask-wearing, quarantine, etc. And the second wave of Covid-19 coincided with the rollout of the so-called Covid vaccines—untried, untested and experimental treatments that are quite unlike the usual flu vaccines. Could any of these unprecedented factors be responsible for changes in the profile of the usual winter burden?
But these are questions for future articles.
Northern Ireland
Curiously, the corresponding EuroMOMO graphs for Northern Ireland differ significantly from those for the Republic. Note that Northern Ireland has only been a contributor to EuroMOMO since April 2016:

The most surprising thing to note is that there was no winter burden in Northern Ireland in January 2019 or in January 2020. In fact, mortality in Northern Ireland was below average between October 2018 and February 2019, and it only slightly exceeded the average in the winter of 2019-2020. Had influenza already disappeared from Northern Ireland more than one year before the onset of the pandemic?
Now let us look at the EuroMOMO data for Ireland’s excess mortality for the period after the onset of the first wave of Covid-19:
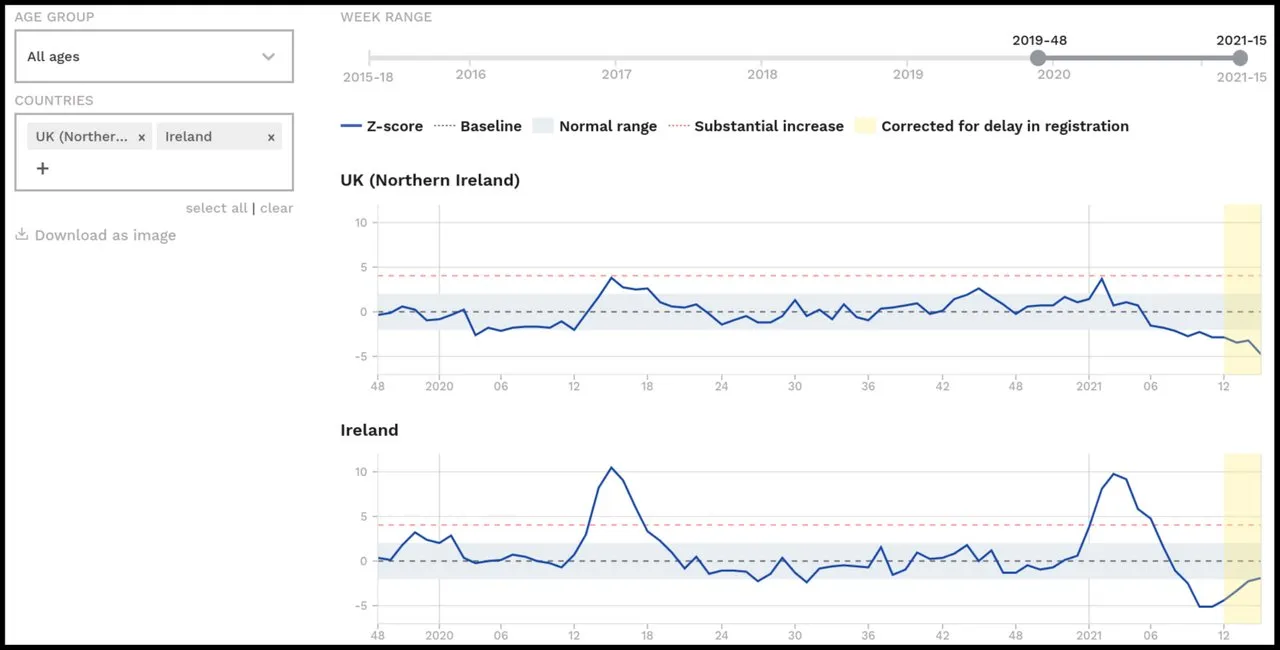
Although Northern Ireland was hit by two waves of Covid-19 at roughly the same time as the Republic—April 2020 and January 2021—the increases in mortality were never as substantial as they were in the South. Note also that the shapes of the North’s Covid spikes were quite different. For the first wave, it looks as though Northern Ireland actually succeeded in “flattening the curve.” And the second wave could easily be mistaken for the usual winter burden of respiratory diseases.
Note also the minor bump in excess mortality that occurred in both jurisdictions around weeks 40-48 (October-November) of 2020. In Northern Ireland, this bump was almost as pronounced as the Covid spikes. In the Republic, however, it was much less pronounced, though still clearly visible. What caused this bump in mortality? Was it related in any way to the progress of Covid-19?

Accounting for these differences in the mortality patterns of the two parts of Ireland will be challenging. It would be a strange pathogen indeed that could exhibit such a disparity of behaviour on opposite sides of an international boundary—especially on a sparsely populated island like Ireland.
And that’s a good place to stop.
References
- Kieran Morrissey, Ireland: Study of COVID-19 Deaths, Global Research (2021)
- Denis G Rancourt, All-Cause Mortality during COVID-19: No Plague and a Likely Signature of Mass Homicide by Government Response, Research Gate (2020)
Image Credits
- COVID-19 Poster: © 2021 Dublin Region Homeless Executive, Fair Use
- Excess Mortality in Ireland: © 2021 EuroMOMO, Fair Use
Online Resources
- Ireland: Study of Covid-19 Deaths
- The Manipulation of Covid Mortality Statistics
- What Death Notices Tell Us about the Coronavirus across Ireland
- RIP.ie
- Central Statistics Office (CSO)
- Northern Ireland Statistics and Research Agency (NISRA)
- Covid-19 Pandemic
- Covid-19 Pandemic in the Republic of Ireland
- Covid-19 Pandemic in Northern Ireland
- Irish Government Updates on Covid-19
- Northern Ireland Covid-19 Statistics
- The CIA’s World Factbook