This content was deleted by the author. You can see it from Blockchain History logs.
BTCUSD August 19 2019 Daily Chart
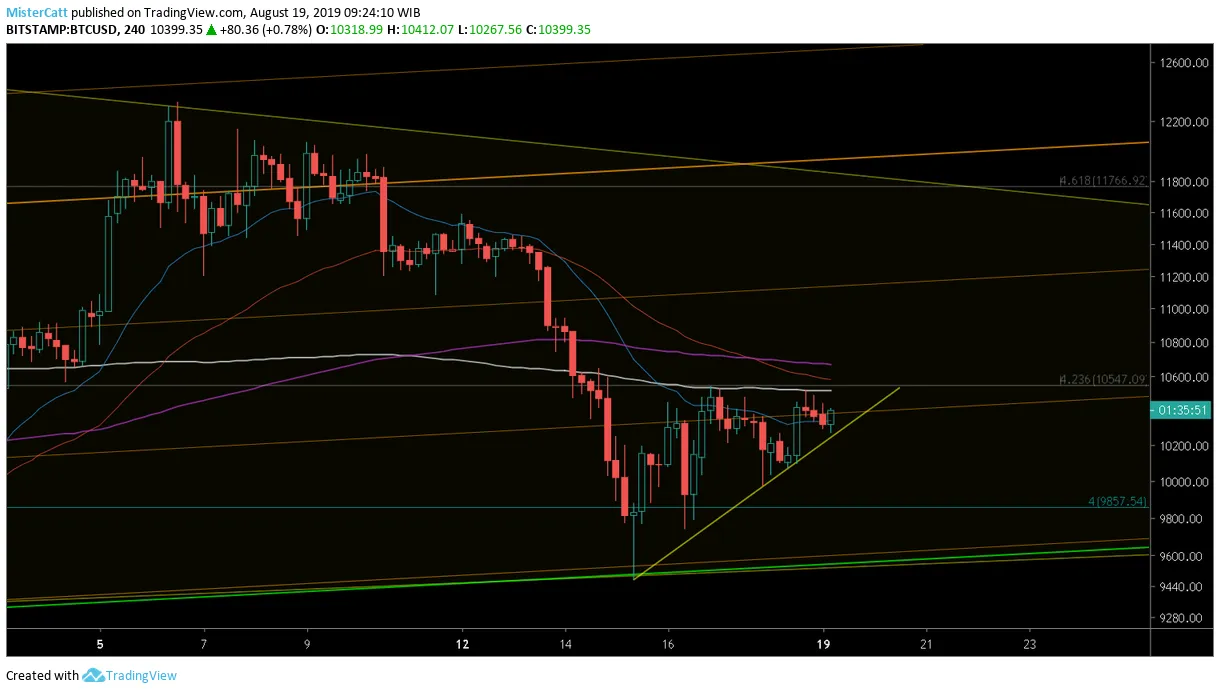
- Short term ; Support 10100 & 9900 || Resistance 10500 & 10600.
- BTCUSD being held back recently by 200 SMA line ( white line at 10500 area) while interestingly create a higher low thus far. Death cross of 4 hour between 200 EMA (purple) & 51 EMA (red) is already occur since yesterday. Meaning a slight of change for bulls to regain it's bullish trend once there's another price decline occur in the future. conversely break above it could result a rally for BTCUSD. which could bring the price action toward next pitchfork resistance (orange) at around 10000 usd price range for short term.
- volume is decline meaning a volatility isnt present yet as it's could either waiting for impulse movement in both way could occur.
- Indicators (from top to bottom) looks bullish on 4 hour.
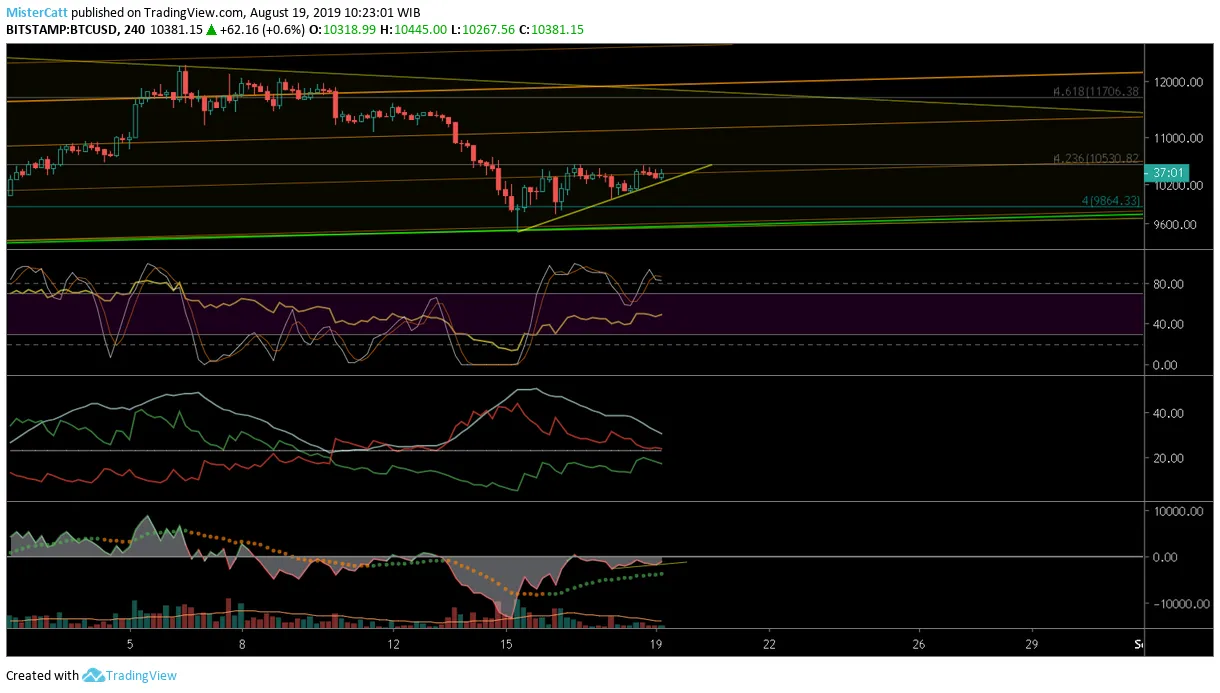
- RSI in between bullish and bearish area while still made a higher low so far. stochastic rsi also on bullish zone while it's prone to little side ways action for this indicator to rest before continue the upside momentum.
- DMI : +DI made a higher low so far. -DI (red color line/sell power) is still consider to give up it's bearish momentum while +DI (green color line/buy power) seems decline to crossover with each other, Momentum strength (white line) is failing so far for -DI. weakness for Bearish is to be seen.
- OBV histogram is made a higher low thus far and it's a good sign for bullish trend if this obv keep it's current level.
Thank you for your time to read this post and please take this idea as a grain of salt as reality always differ from what i expect as this post merely just an opinion.
and please feel free to share what your thought on comment section.
peace.