Crab Pattern -深蟹形态
‘M' & ‘W' 图形的衍生形态
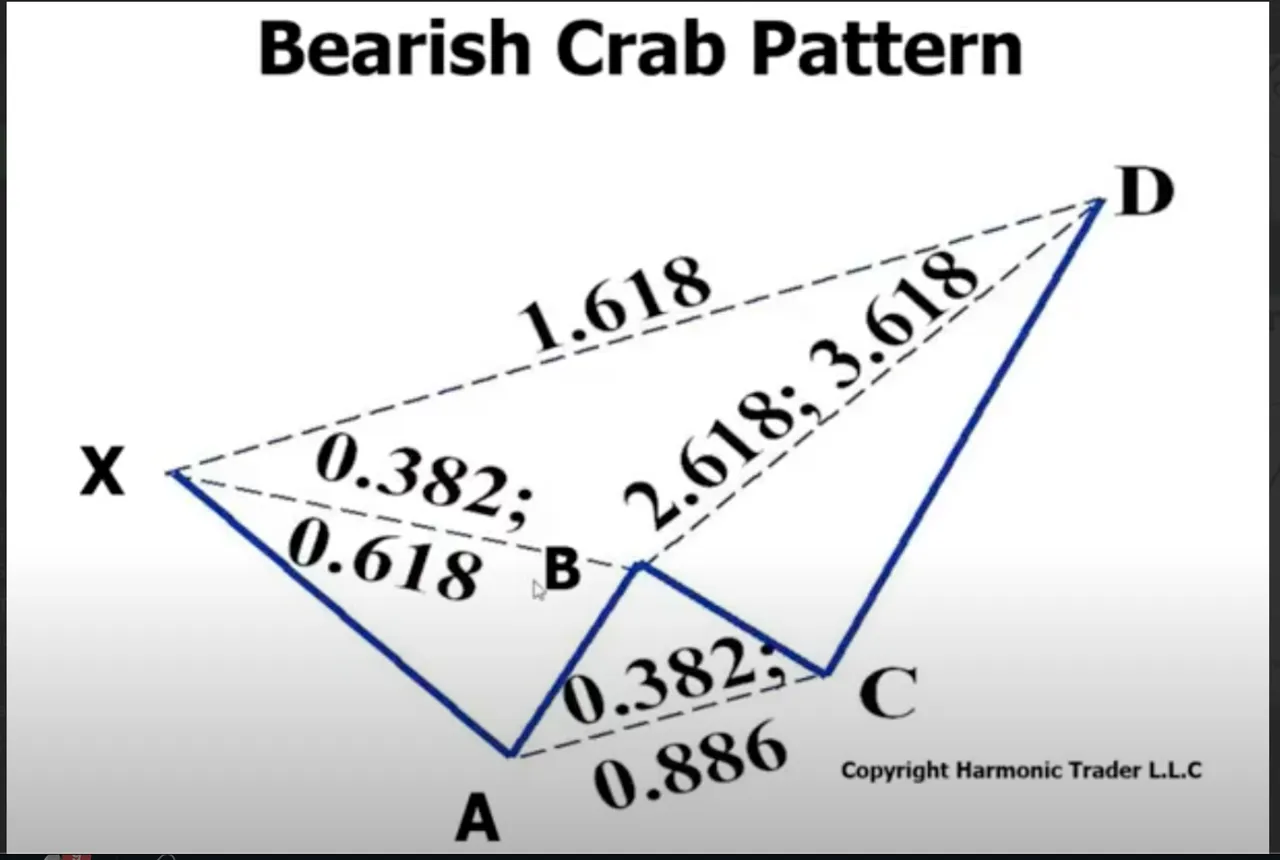
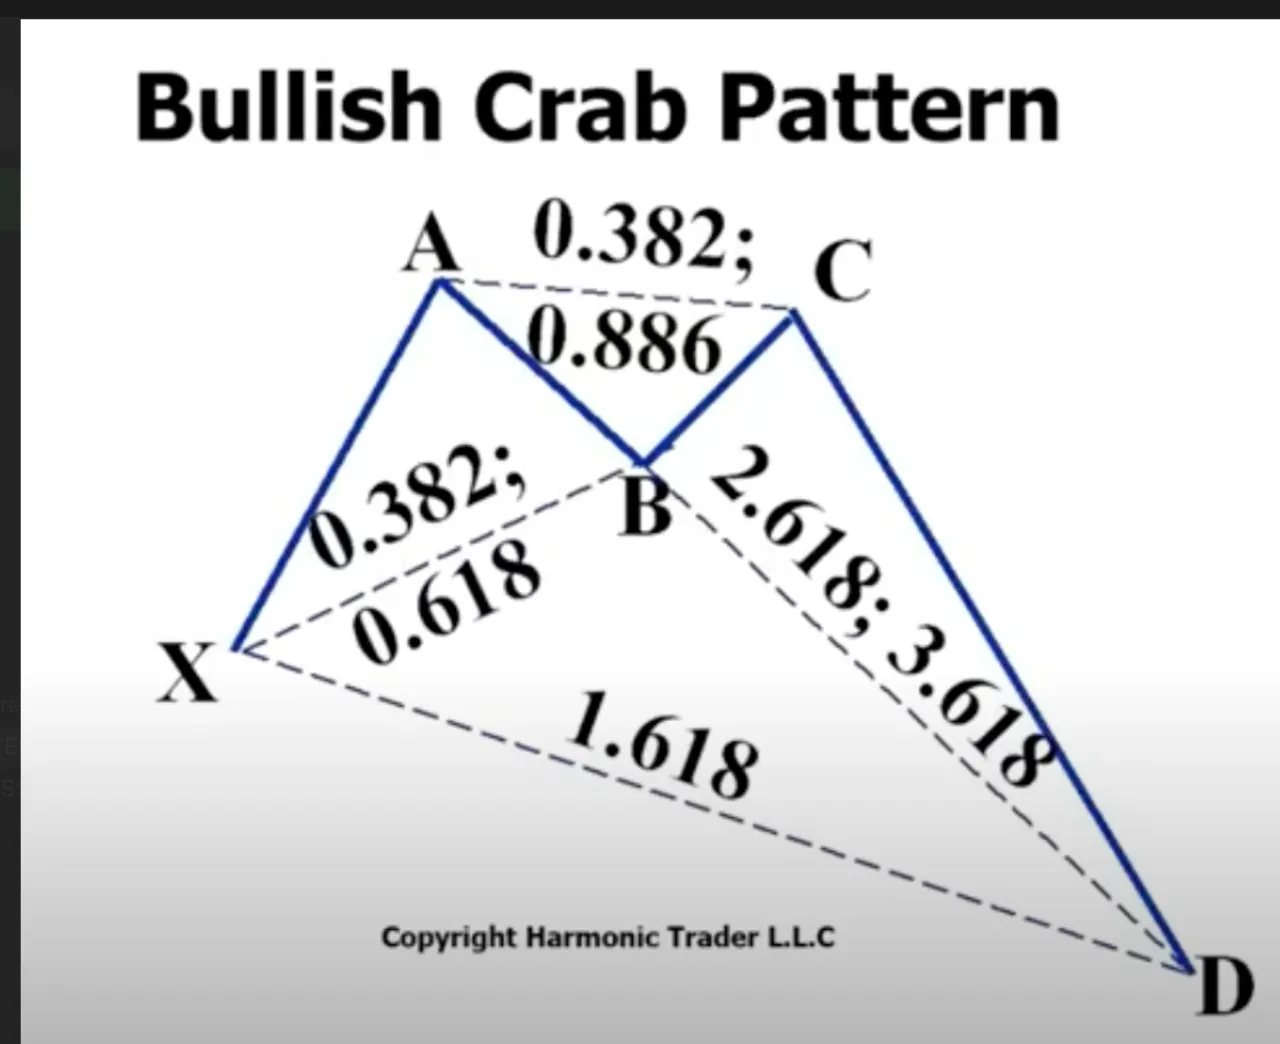
螃蟹形态通常是代表极端volatile 的价格行情走势.通常它的PRZ(potential reverse zone)是延续的,延长很远的价位才发生的
B point 在0.886 是属于deep crab pattern /0.382-0.618 是属于regular crab.
D点位是xa延展的1.618 fibo extension
TP: C&A 点位
Stop loss : 在XA1.618 之后的2.000为stop loss, tp 应该怎么设定呢?直接放移动止盈动作吧。
配合price action是相当有用的指标,pin bar/黄昏十字星等
当价格突破X点还有B点是,可以很肯定这个形态是有很高概率形成的了。
AB=0.618 XA

XD=1.618 XA

BD=2.28-3.14 XA