Another cryptocurrency trading analysis brought to you. 1INCH/USDT is trading at 4.21USDT and it already observed a good spike of raise to more that 7USDT and then correction was observed. Currently crypto seems to be in an accumulation phase. Here is the chart with Support and Resistance lines drawn by me.
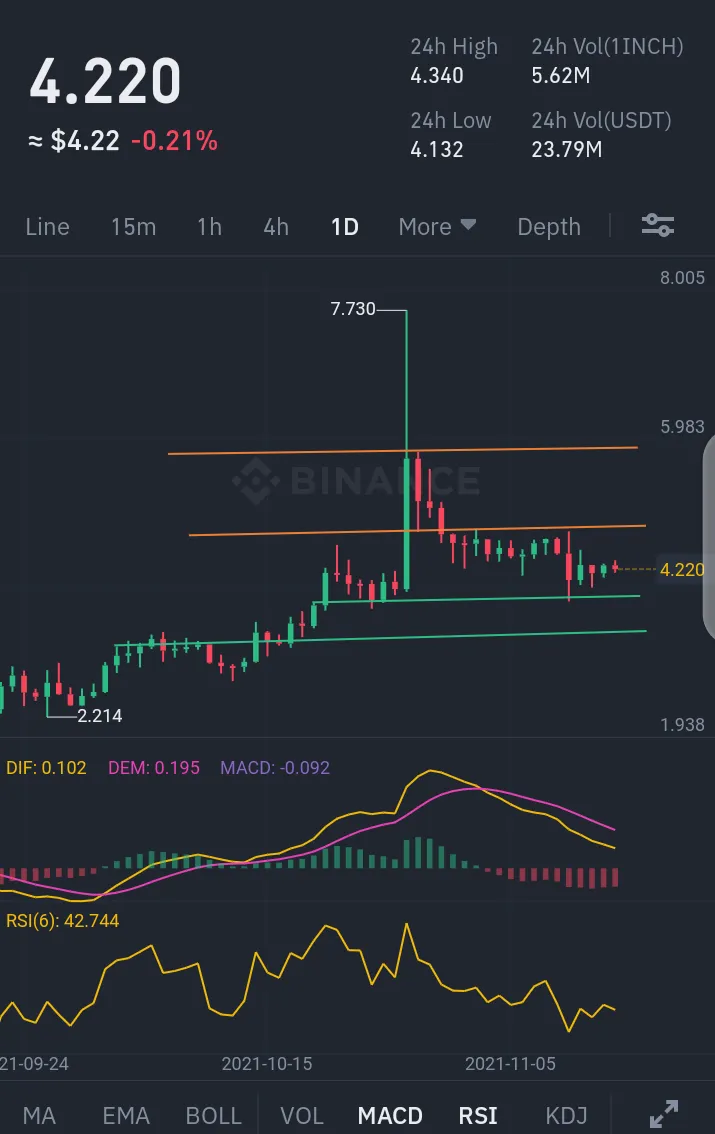
Chart from Binance mobile app
S1: 3.88
S2: 3.34
R1: 4.79
R2: 5.81
MACD is above zero but approaching towards zero with a selling histogram trend, thus investors seem to be selling out and taking profits and trend may make more correction till 3.88 or even second support point 3.34. RSI is also showing downtrend. 3.34 is a strong support and buying can be made with stop loss of 3.10. Thanks!
Legal Disclaimer: I am not a financial advisor and never give advise to take any trade. The purpose of the analysis is for information only and you have to do your own working before taking any trade. I will not be responsible under any circumstances for any kind of loss.
Best of luck!