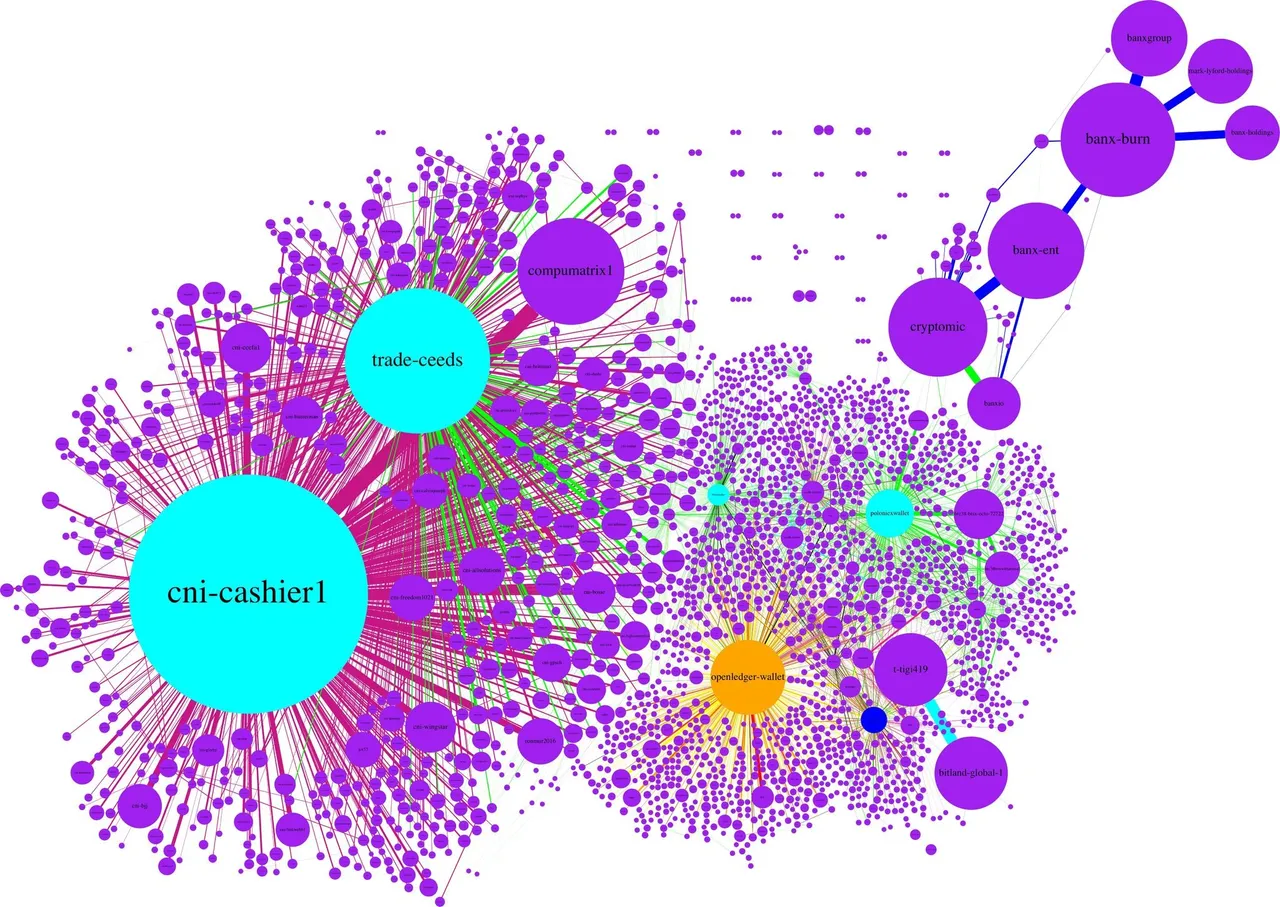
(Improved) Bitshares transaction network graph made from the transactions in the past 30 days.
[ ]
]
Large PNG
Download SVGZ to zoom in to your heart's content
(legend/information below)
My previous bitshares transaction graph had some problems and most of them are fixed in version 2. I switched from using graph-tool only to using graph-tool and graphviz (@xeroc 's recommendation) and improved the following:
- No more overlapping nodes
- Meaningful use of colours
- Using vector graphics
- Filter for UIA's with artificially high prices
I used transactions from the past 30 days as data for the graph, partly because of comments made by @fuunyK in the bitshares telegram group and I wanted to show data supporting or invalidating that statement.
Again... just imagine bitshares without ccedk, open assets and Open Ledger, here and now. Z-E-R-O transactions. The real problem here is the fact that today there is nothing but The Open Ledger conglomerate that add transactions and value to bitshares. I hope for more valuable project and less empty words.
FuunyK
Legend/Explanation:
Data - Transactions from the past 30 days, only transactions with a value of more than $1 are included.
Size of nodes - The total transaction volume on the account (sent+received). The total transaction volume and the size are square root related.
Width of edges - The size of the transaction (square root relationship)
| Minimum amount of transactions | Node color |
|---|---|
| 0 |  |
| 180 |  |
| 360 |  |
| 540 |  |
| 720 |  |
| 900 |  |
| 1080 |  |
| Asset | Edge color |
|---|---|
| COMPUCEEDS |  |
| BANX | |
| CADASTRAL | |
| BTS | |
| BTC | |
| DGD | |
| ETH |  |
| LSK | |
| OBITS |  |
| ICOO |  |
| SOLCERT |  |
| DAO |  |
| STEEM |  |
Note: these colors are for the SVG version of the graph, the colors in the PNG version are a bit different