Hello Everyone, Today i am share about IOTA (MIOTA) are now close to a trend reversal as can be seen on the IOTA/USD daily chart above and investors are looking to load up on their favorite coins. The chart above shows that IOTA (MIOTA) has respected a historical support line for IOTA/USD since it started trading on Bitfinex, before July 2017. The downtrend resistance since the beginning of the correction has only been tested twice and not been breached once. The price has now started to settle at the lower limit of the triangle it is trading in, and is consolidating before its next move.
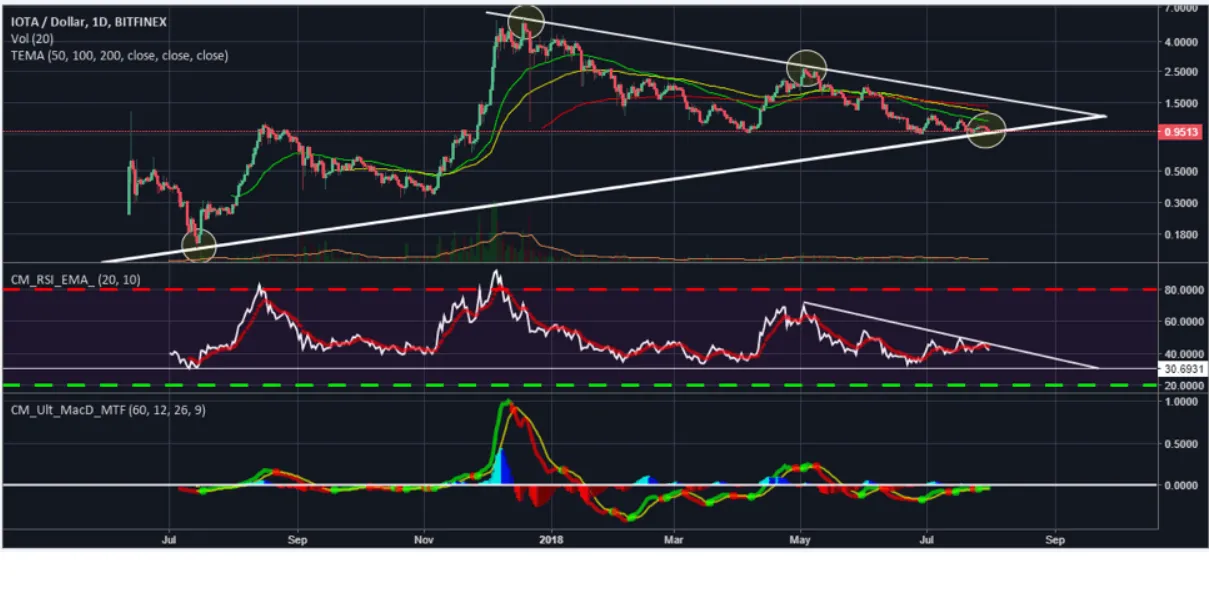
According to the Technical conditions on the chart favor a rally at this point as breaking support at this point might push IOTA (MIOTA) in a long term bear market. RSI is trading below 40 which indicate that there is a lack of momentum for further downside. MACD graph shows that another run up would most likely coincide with the altcoin rally that could push the price to a new all time high. While technical indicators seem good for an upcoming rally, there have to be fundamental catalysts to push the price higher.
Thankx
Vikas Kumar
@vikas23