A Morale-Boosting Pill for the Faint-Hearted
The recent slump in Bitcoin (BTC) and other cryptocurrency prices has left many crypto enthusiasts feeling faint-hearted. While the markets seem to have bottomed out already, there are still those who now have fears attached to their BTC holdings. There are also some who are making good of the recent slump in cryptocurrency prices by buying low. And then, there are these other sets of investors and traders who have always remained extremely bullish about Bitcoin (BTC) and its prospects and have been parking funds into the crypto at every opportunity. Well, if you do find yourself in any of the above categories, this post should serve you well.
Do you Believe in the Future?
In its simplest form, futures contracts are a trader’s bet on the future price of an asset. So, the Bitcoin futures, whether it be the CBOE or CME Bitcoin futures, or the soon-to-be-launched NASDAQ Bitcoin futures, are derivatives that assess a market maker’s expectations with the price of the underlying, which is BTC. We looked at the CME Bitcoin futures chart for the past month and noticed a clear reversing pattern.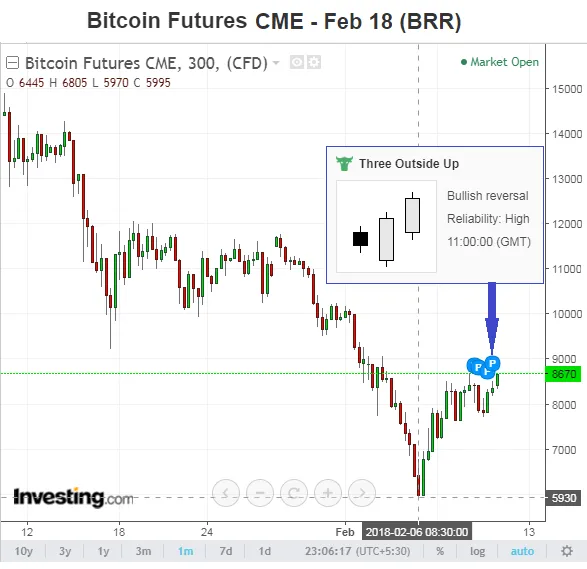
Now, since futures prices are mere market estimates of what the price of the underlying could be at a certain future date, a rising trend is an indication of a bullish expectation with the underlying, and vice versa. The chart above plots the quotes history for the CME Bitcoin futures, expiring in February. As per the last Friday of the contract month rule, the last trading day should fall on February 23rd for these futures.
Technical Analysis Hinting at the Acceleration of an Uptrend
Additionally, technical analysis identifies a three outside up pattern (chart above) being formed wherein the first candle marks the beginning of the end for the prevailing trend (the downtrend) as the second candle engulfs the first candle. The third candle marks an acceleration of the reversal (into an uptrend) as there’s a failure to surpass the second candle to maintain the prior trend. The three outside up pattern is a reliable indicator of a reversal.
However, traders and investors should use these indicators as a primary trading signal, and look for support signals from fundamental or market indicators as well. News and views from regulators, banks, dealers, and data scientists, among others, could help solidify one’s view with respect to the future of BTC in the short term.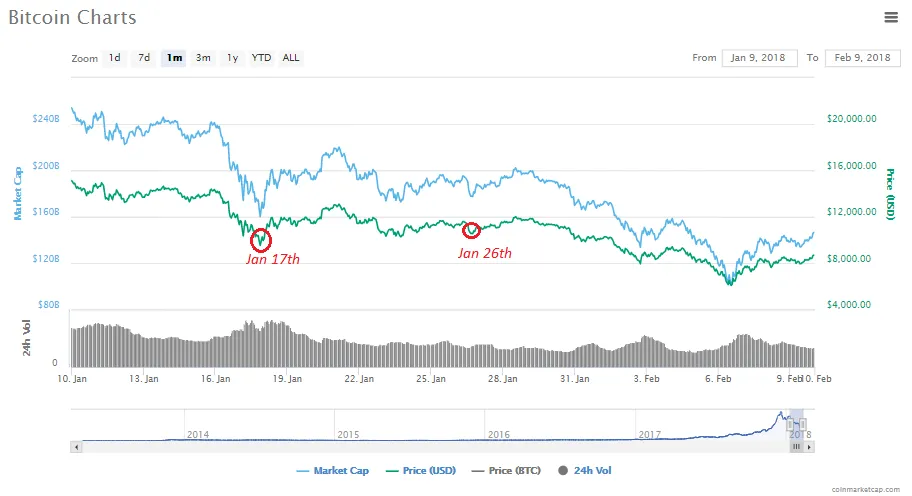 Important Caveat
While the overall sentiment of the market for Bitcoin is expected to remain bullish, the spot market may experience a short-term dip when any of the Bitcoin futures come to expiration. Some say that this is initiated by institutional investors who drive down the spot price to make gains on their fixed-price expiring futures contracts. Nonetheless, Bitcoin futures being cash-settled does open up the opportunity for price manipulation by aggressive end-of-day buyers and sellers. In January, we saw notable dips (char above) in the price on January 17thth (CBOE Jan Bitcoin futures expiry), and on January 26th (CME Jan Bitcoin futures expiry). This month, these dates could be February 14th (CBOE) and February 23rd (CME).