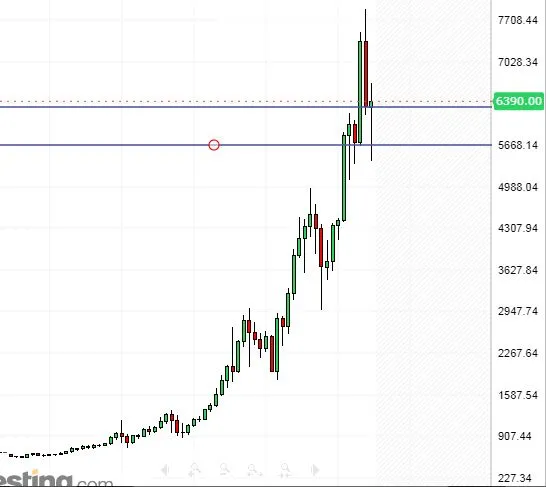
First up is Bitcoin which we all know has begun a recovery after dropping hard this past weekend. The hash rate for BTC also dropped, leading to a short term drop in price and a huge slowdown in bitcoin transactions. The hash rate must be watched closely going forward in my opinion in order to avoid another such price drop.
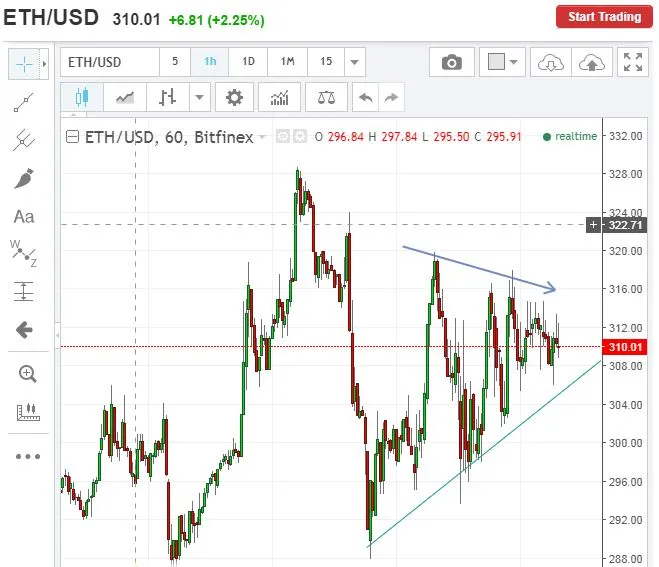
Ethereum has been a crypto that I have been bullish on all year, although I expected ETH to be trading much higher than it is right now. However, the hourly chart shows a wedge forming, following the head and shoulders formation that lead to the strong price drop. If ETH can break above the top trend line than it should move higher. Long term I am still bullish on ETH and it is still one of my favorites for buy and hold.
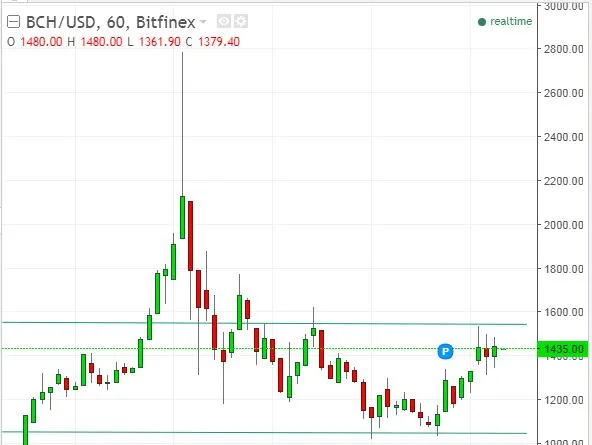
Bitcoin cash spiked hard, but then dropped back into this resistance zone following the price rise. The reason for this is the BTC cash developers changed their rules since they didn't want the fluctuations in the hash rate that makes the price more subject to rapid change. If BTC cash can get back above this resistance zone, than it might be a nice short term money maker, but until it does, I won't be touching it.