For last 5 days, bitcoin's price is ranging between $5500 and $6000 level. On 24th October it created a bearish candle and after that for the last 5 days, it's unable to break above or below this candle.
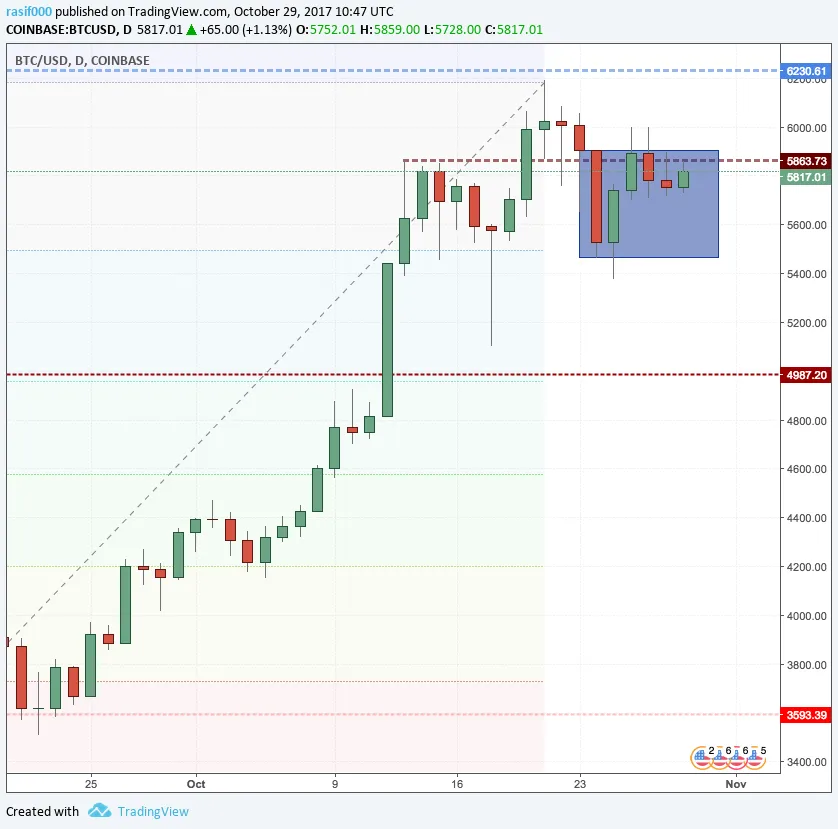
So currently market is in ranging condition and it's waiting for a break either above or below this level. But there's a potential support level at $5000 level.
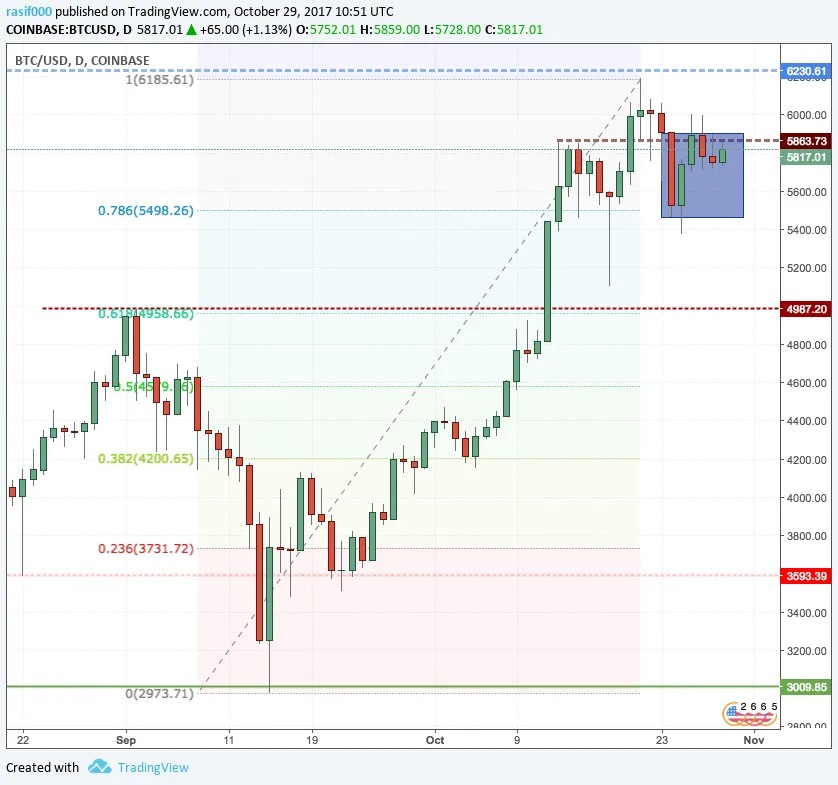
So, I'm right now I'm waiting for some sort of confirmation. Will update you guys if I find any good opportunity to trade. Till then follow and upvote if you like. :D