I have made a list of all major Bitcoin corrections since 2012 including the number of days it took to reach a new all time high again.
The heavier the correction, the longer it took to achieve a new all-time-high again.
The latest correction (or crash if you will) was a pretty heavy one: 70% in 51 days.
Of course it is not yet certain if we have seen the bottom, but I do think so. On to a new all time high! However, the last time we saw a 70% correction was late 2013 when it took almost 3 years to make a new all time high again. The fundamentals for the crypto space as a whole are much better now in my opinion, so I don't think it will take 3 years again, but it might take a little while though...
What do you think? Will we see a new all-time-high this year?
If you ask me, YES! I predict Q4 2018.
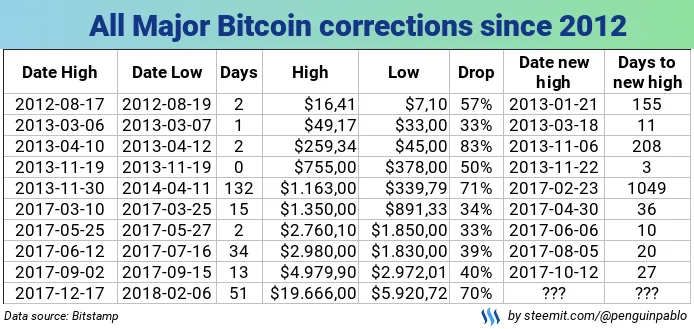
All major Bitcoin corrections since 2012
| Date High | Date Low | Days | High | Low | Drop | Date new high | Days to new high |
|---|---|---|---|---|---|---|---|
| 2012-08-17 | 2012-08-19 | 2 | $16,41 | $7,10 | 57% | 2013-01-21 | 155 |
| 2013-03-06 | 2013-03-07 | 1 | $49,17 | $33,00 | 33% | 2013-03-18 | 11 |
| 2013-04-10 | 2013-04-12 | 2 | $259,34 | $45,00 | 83% | 2013-11-06 | 208 |
| 2013-11-19 | 2013-11-19 | 0 | $755,00 | $378,00 | 50% | 2013-11-22 | 3 |
| 2013-11-30 | 2014-04-11 | 132 | $1.163,00 | $339,79 | 71% | 2017-02-23 | 1049 |
| 2017-03-10 | 2017-03-25 | 15 | $1.350,00 | $891,33 | 34% | 2017-04-30 | 36 |
| 2017-05-25 | 2017-05-27 | 2 | $2.760,10 | $1.850,00 | 33% | 2017-06-06 | 10 |
| 2017-06-12 | 2017-07-16 | 34 | $2.980,00 | $1.830,00 | 39% | 2017-08-05 | 20 |
| 2017-09-02 | 2017-09-15 | 13 | $4.979,90 | $2.972,01 | 40% | 2017-10-12 | 27 |
| 2017-12-17 | 2018-02-06 | 51 | $19.666,00 | $5.920,72 | 70% | ??? | ??? |
SteemBlockExplorer.com - SteemNow.com - CoinMarkets.today
¯\___(ツ)____/¯ Follow me @penguinpablo