Is it a natural fractal that all assets with limited supply are manipulated according to the same fairly simple scheme by powerful structures controlling the circulation of money? Probably so. And perhaps human nature itself a fractal and we have been living in the matrix, which likes to say Elon Musk.

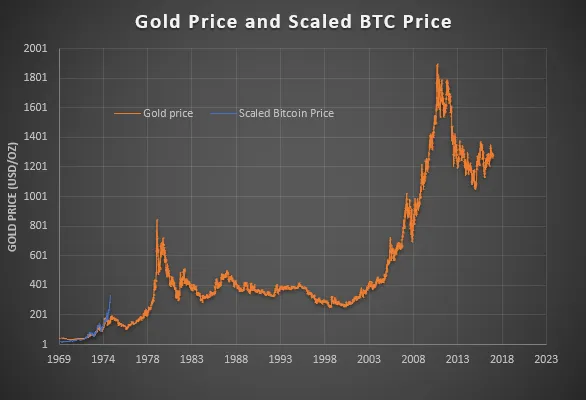
Now back to gold, the graph shows the overlay of gold prices and bitcoin prices. So, in 1974, the first gold futures contract was signed on the COMEX in New York, and the trades began symbolically on December 31. And look what happened next.
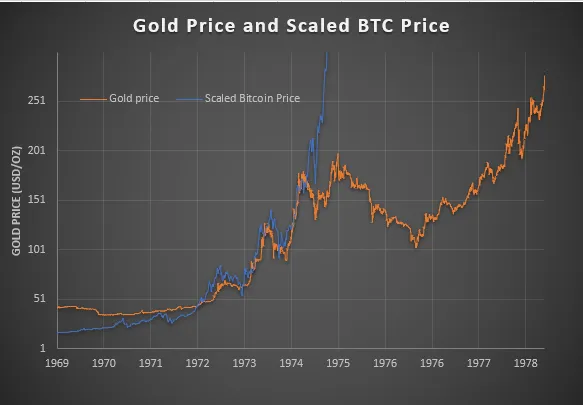
The price of gold fell by 50% within two years after the opening of futures. Is There direct relationship between these two events, definitely yes, because before the opening of futures, gold has always grown in its history, and here it began to fall even on the segment in 3 and a half years. After that, new growth began, which was crushed by the coordinated action of G7 central banks. How it can tell the future behavior of the exchange rate of bitcoin? First, just before the collapse of the bitcoin exchange rate last year, bitcoin futures trading on the Chicago Stock Exchange was opened, and then both charts coincided to almost complete accuracy.
There are clearly interpolated two levels to which the price of bitcoin will reach before it turns down. The first level is $60K-80K, before the big dump, then, the next $180K and so on. Time on this scale should be accelerated by 4.5 times, it is at this scale that the curves coincide.
In order to accept this assumption for the correct forecast, we have to take into account the fact that there are now several differences between gold in 1974 and bitcoin:
The previous parts:
