
August 10th 2021, Crypto Chartbook: Bitcoin, told you so
Investor psychology and financial markets have a unique dynamic. Never assume that you can step into this arena and are mutually successful just because you did well in your profession. The rules are very different, and your intuition isn’t worth a dime. And yet, very few step aside after initial failure and skip market play altogether, even though this would be the best move for most. Why is market participation so elusive in regard to making you a winner. Timing? Bitcoin, told you so.
When uncertain, we typically wait and see until we find evidence for a more clear-looking bet. Fatal in market play. When you hear the grocery bag packers flipping their third real estate property, you don’t go purchase real estate. Same in market play, but then we typically hear about investments from the news, and these only wake up when the move is on its way or already over.
A future that might hold a place for Bitcoin
Bitcoin gets downplayed by some, to only be a mathematical experiment. Others claim that any market this volatile isn’t useful for any practical application. If you take the time to read the last sentence of each of our chart book publications over the last year or two, you will find principles supporting that these doubters’ comments are unfounded. In addition, you will find most of the principles on how we take bets in a low-risk manner and have yet consistently taken profits.
We are not here to sell you a trading service, entry signals, or Bitcoin. Neither are we Bitcoin fanatics. We merely try to open the door to explore the possibility that the future might hold a place for Bitcoin, where it might be unwise to ignore it now since, in market play, anticipatory behavior is much more profitable than the reactionary “sit and wait.” To avoid having to listen to, I told you so.
BTC-USD, Weekly Chart, Before and after:
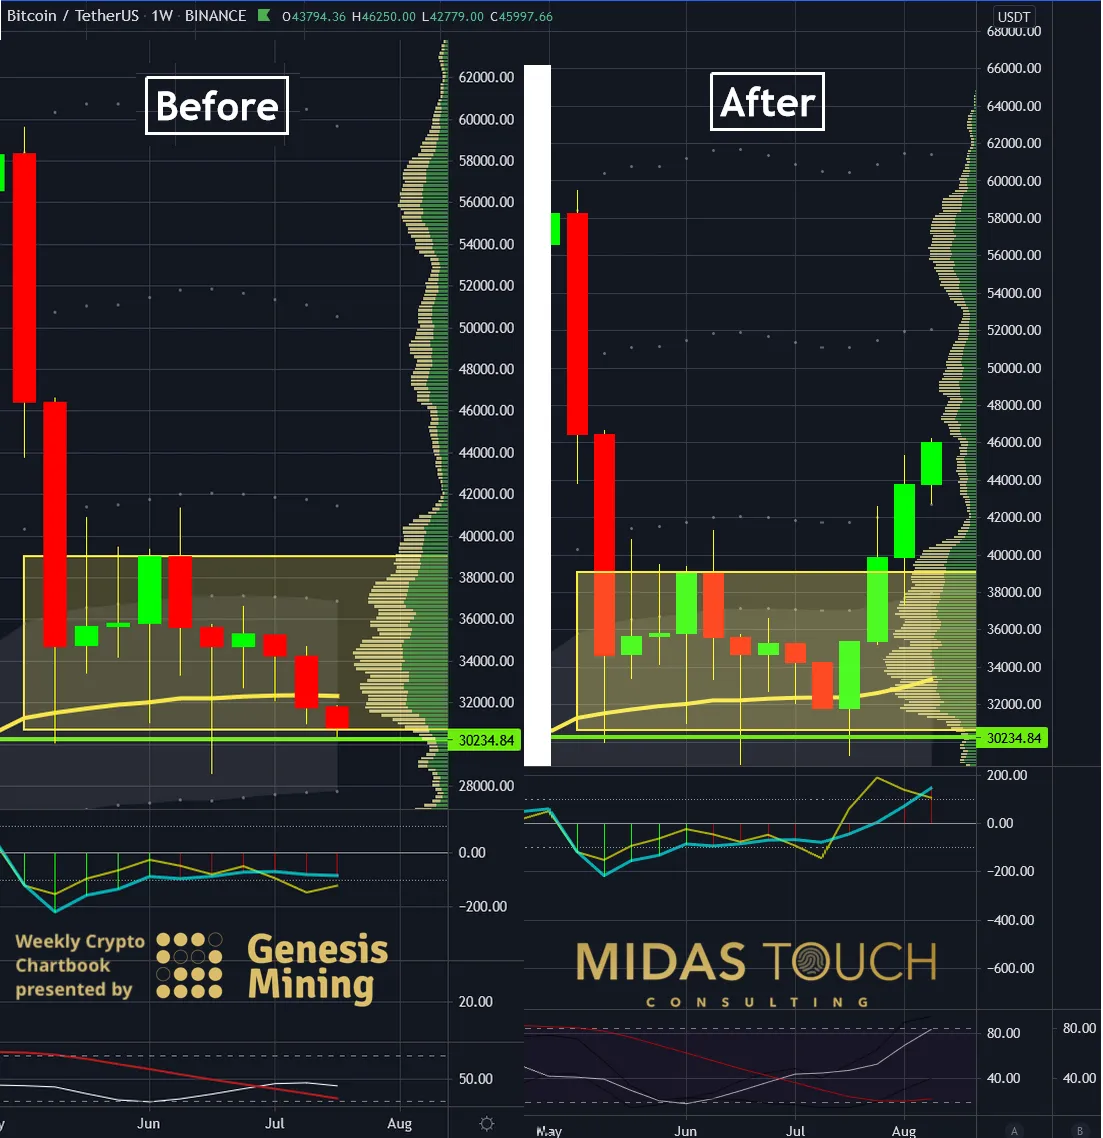
Bitcoin in US-Dollar, weekly chart as of August 10th, 2021.
Three weeks ago, we posted this chart in our weekly chartbook release with the following text: “The weekly chart above shows an entry possibility on low risk near prices on the bottom of a sideways range right now (yellow box). This 10 week trading range between US$30,000 and US$39,000 has substantial fractal volume support, as shown in the histogram on the right side of the chart. We also find previous price support (see a green horizontal line). In addition, prices trade at the mean, a typical reversal and support spot (yellow directional line).”
Consequently, we took six entries at these lows in a range from US$29,303 to US$32,004 (posted in real-time in our free Telegram channel).
The right side of the chart shows what happened in the last three weeks. Right after the chart book’s release, the cards turned and the very right last candle of the left chart turned green. Since then Bitcoin advanced by 55% (a move from US$29,278 to US$45,310).
BTC-USD, Weekly Chart, Dos and don’ts:
Bitcoin in US-Dollar, weekly chart as of August 10th, 2021. entries
While the precious metal sector gets pushed down by manipulators to cover their shorts, Bitcoin merely flinched at the 200-day moving average after its 55% up-move. Retracements here are opportunities since once prices see all-time highs again, the news will step in, and a crowd awakens that will have a hard time trying to get into the market. Either look for entries in the next retracement or below new all-time highs for anticipatory positioning. Another way is watching new all-time highs getting printed and entering into the following retracement, but try to avoid seeking out a breakout trade to new highs or chasing a trade when in motion.
Entry opportunities:
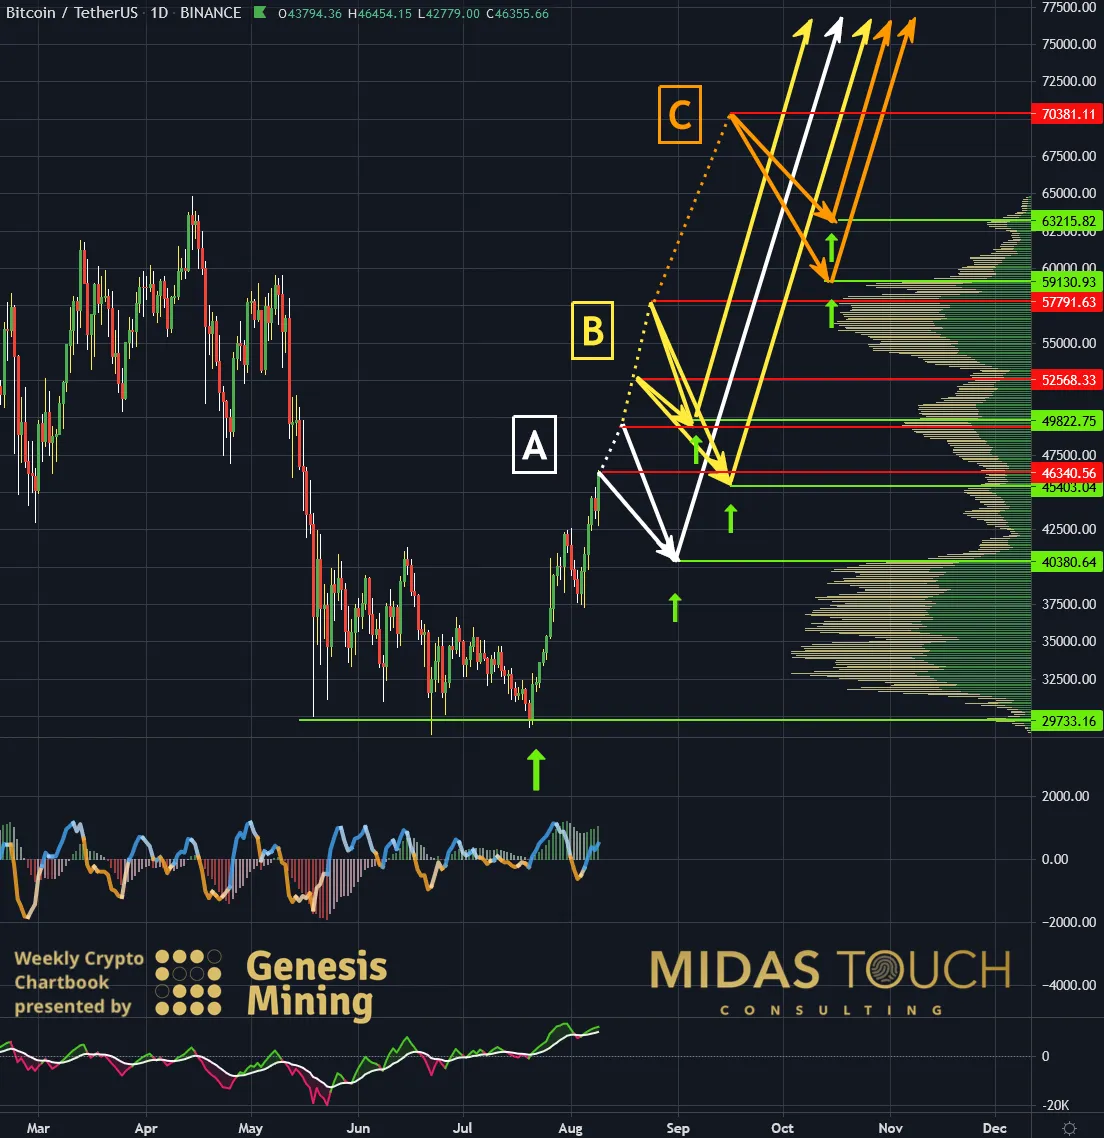
We have set a plan of three zones (A, B, C), that we find low risk for reentries in addition to our holdings from the US$30,000 level.
- In Zone A, we see two possible retracements. Either from price levels right here at time of publication towards a supply zone measured by fractal volume analysis near US$40,380 or a retracement from US$49,354 to also US$40,380.
- Zone B provides three entry levels to us. A retracement from US$52,568 to the entry zone near US$49,822 or US$52,568 down to US$45,403 or even US$57,791 down to US$45,403.
- Zone C would be a reload zone after a successful breakout to new all-time highs with a retracement from somewhere near US$70,000 to either US$63,215 or US$59,130. As mentioned, we are not interested in engaging near the all-time highs
The entry levels above are only temporary since our approach is not based on support/resistance levels but rather a conglomerate of principle-based edges that adjust in real-time, so stay tuned for our next weekly chartbook publication for updated data.
BTC-USD, Daily Chart, Beauty in simplicity:
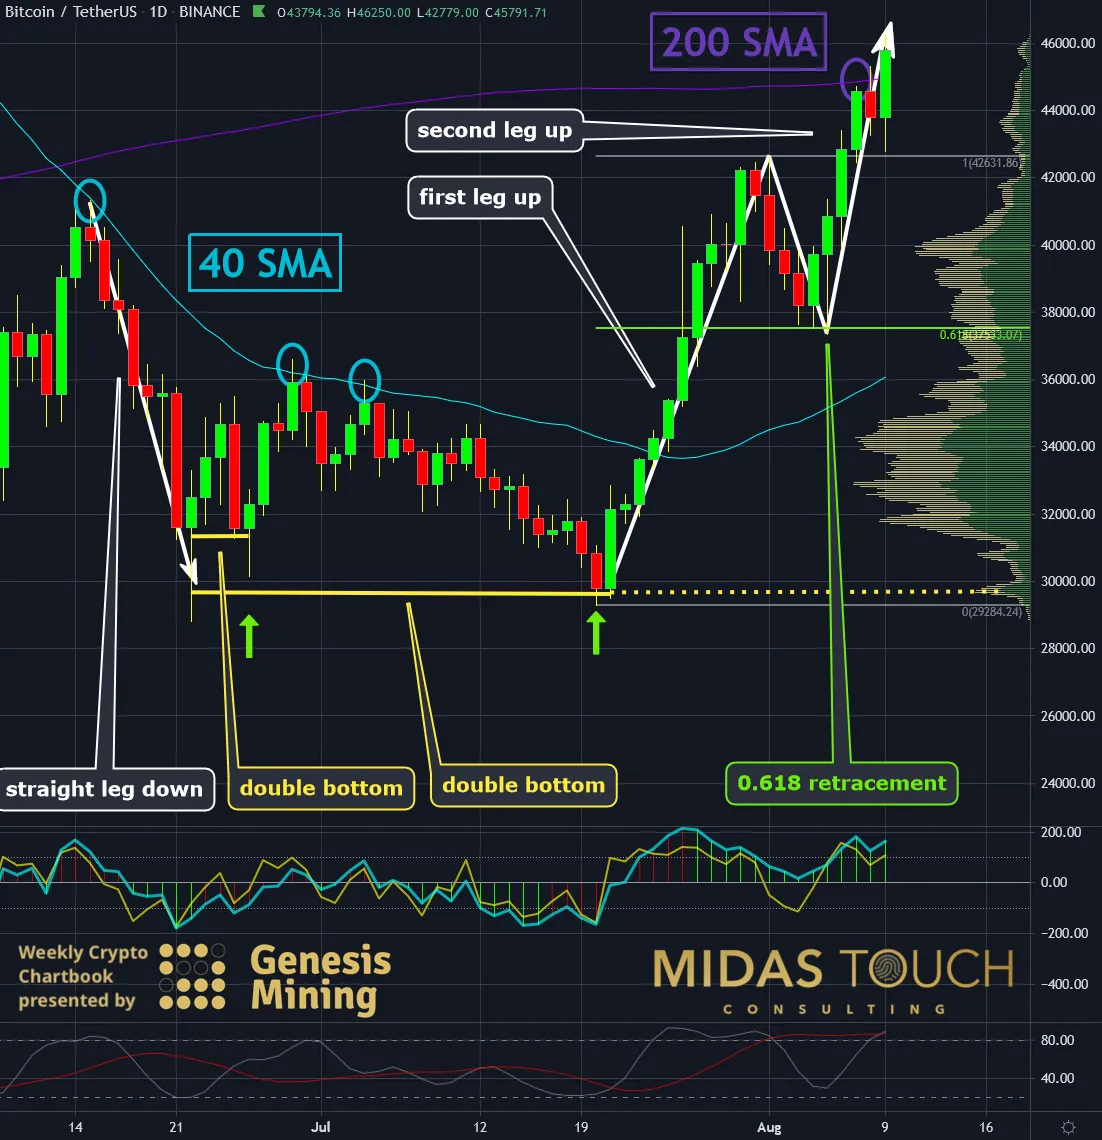
Bitcoin in US-Dollar, daily chart as of August 10th, 2021.
Yes, Bitcoin has substantial percentage moves both in advancements and retracements. Which doesn’t make it a problematic trading instrument. Look at recent price behavior from a simple technical analysis perspective. You will find:
- Clean straight legs without chop or high-risk volatility
- Clear identifiable double bottoms for entry selection (green up arrows)
- The 40-day and the 200-day simple moving average for targets
- Clean support levels by either Fibonacci numbers or fractal volume analysis (supply and demand zones)
- Easy spottable trend development (first, second leg)
- And as a result, excellent risk/reward-ratios. Most of all, low-risk trade opportunities.
No rocket science is needed to find low-risk entry and exit points.
We are not saying trading is easy. Far from it, we would like to demystify a market that finds a lot of criticism. It has a reputation non-reflective of its one trillion-dollar market capitalization.
Staying away from rumors both in news and other sources and identifying low-risk entry points oneself supports confidence in one’s own actions.
We live in times where it has become very hard to trust. Everybody wants to sell you something, and there are sources without a density of lies are rare. A general over information rules our daily routines. In market participation, too much data creates doubt. Keep it simple and self-directed, and you will be very much ahead of the crowd.
Bitcoin, told you so:
Why so many market participants are consistent losers is due to their timing. When your neighbor or a famous CNBC anchor steps up and says, “I told you so, now Amazon is trading at US$3,330, and I recommended it at US$2,000”, it is not the time to chase the trade. And yet we can’t help it to buy precisely then (fear of missing out). And when all is quiet, and people speak doomsday about Bitcoin while its temporary decline, it seems impossible to commit oneself to a low-risk entry. Contemplate this counterintuitive paradigm. Experience the difficulty of being a contrarian by simply making a ten-dollar bet. Realizing that all of this is in one’s head and that one can master obstacles like this through training just like a muscle in the gym.
We are adamant about this since quitting market play is just fine, but quitting the possible need to protect your assets from a vastly different future could be costly. Overwhelm can be overcome by small first steps and realizing that more is needed than following news and that a proactive self-directed step is much more self-empowering than to listen to; I told you so one more time.
Feel free to join us in our free Telegram channel for daily real time data and a great community.
If you like to get regular updates on our gold model, precious metals and cryptocurrencies you can subscribe to our free newsletter.