While there are multiple useful (statistically significant) indicators of when a market is due for a correction (pointing out times that it's "probabilistically unwise" to buy, never really predicting a specific price for a top), there's only ONE that I consider the "go to" indicator in essentially any situation.
What is it James? What is that indicator?
Envelopes... and I don't mean the kind that your grandmother sends you every Christmas. I mean these:
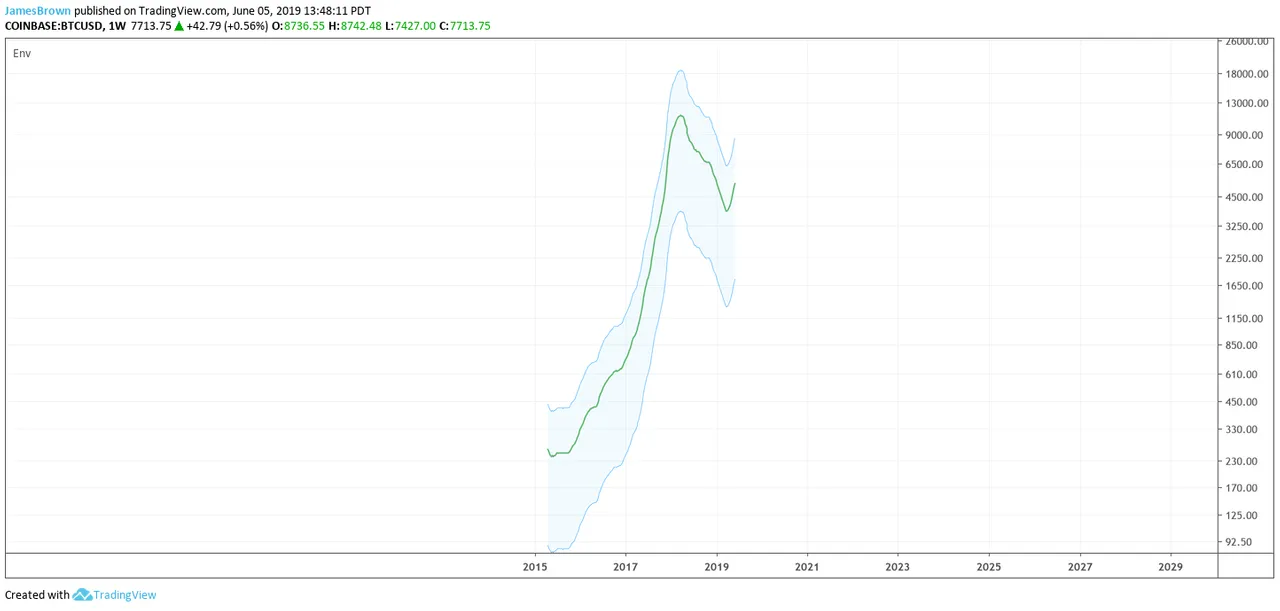
Moving average envelopes - moving averages "enveloped" by a percentage range (that you set in the indicator's parameters).
What you see above is the 20 weekly (simple) moving average of BTC, set at 66%, with the actual price bars of BTC set to invisible. The green line in the middle of the bands is the 20 weekly moving average (20 WMA) and the bands are set at 66% above and below that calculation.
Wow, that's impressive! ... but what's the deal?
The idea is to find a moving average at some timeframe (hourly, daily, weekly, monthly, yearly, etc), preferably a higher timeframe, that price clearly "respects" as support/ resistance and then to determine a price range around that moving average that price is mostly contained within (at least 90% of the time, but preferably closer to 95%), that also clearly acts as a support/ resistance to price.
Going back to that same chart, now with BTC price candles included (Coinbase, Weekly Log Chart)...
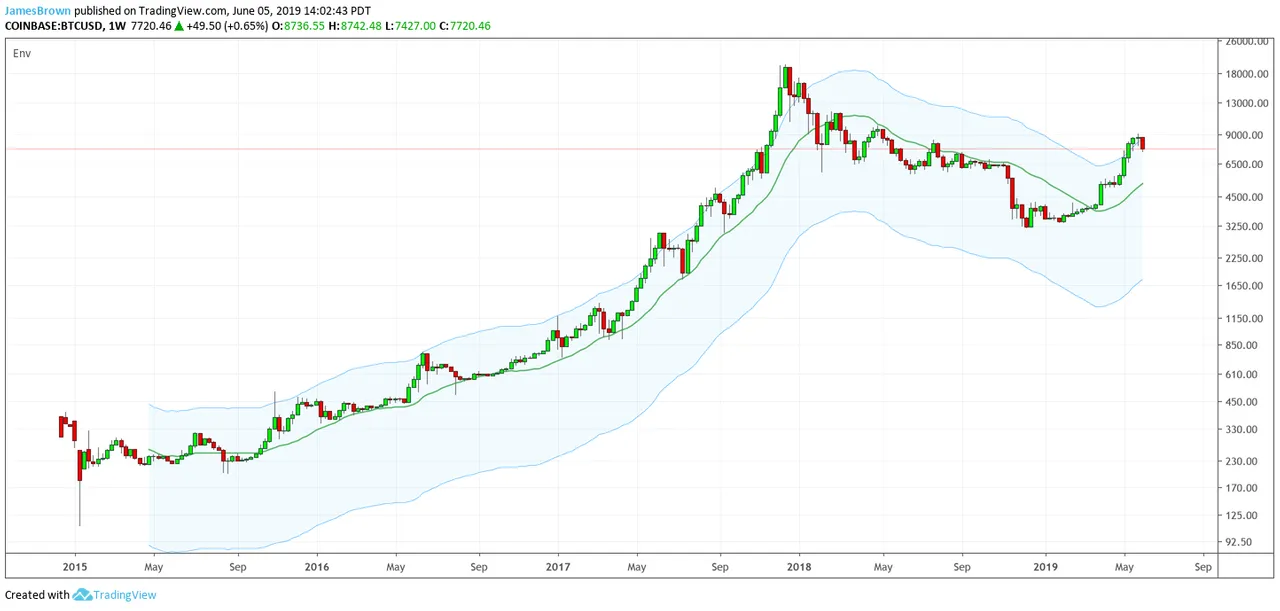
https://www.tradingview.com/x/BGJxDSEN/
...we can see that these conditions are clearly met. Price gave major respect to the 20 WMA as support on its run up from late 2015 to it's all-time high (ATH) in December of 2017 and it did likewise as resistance on its run down from that ATH until its lowest low after that date in late December of 2018.
Furthermore, we can see that over 90% of the price action happened between the lower and upper bands (set here at 66%) and that the upper band demonstrated a tendency to act as resistance to price advancements.
And therein lies the usefulness of this indicator at this present time.
Therein... wherein?
Herein:
Look at that chart again, but let me zoom in a bit and point out where BTC's price currently stands:
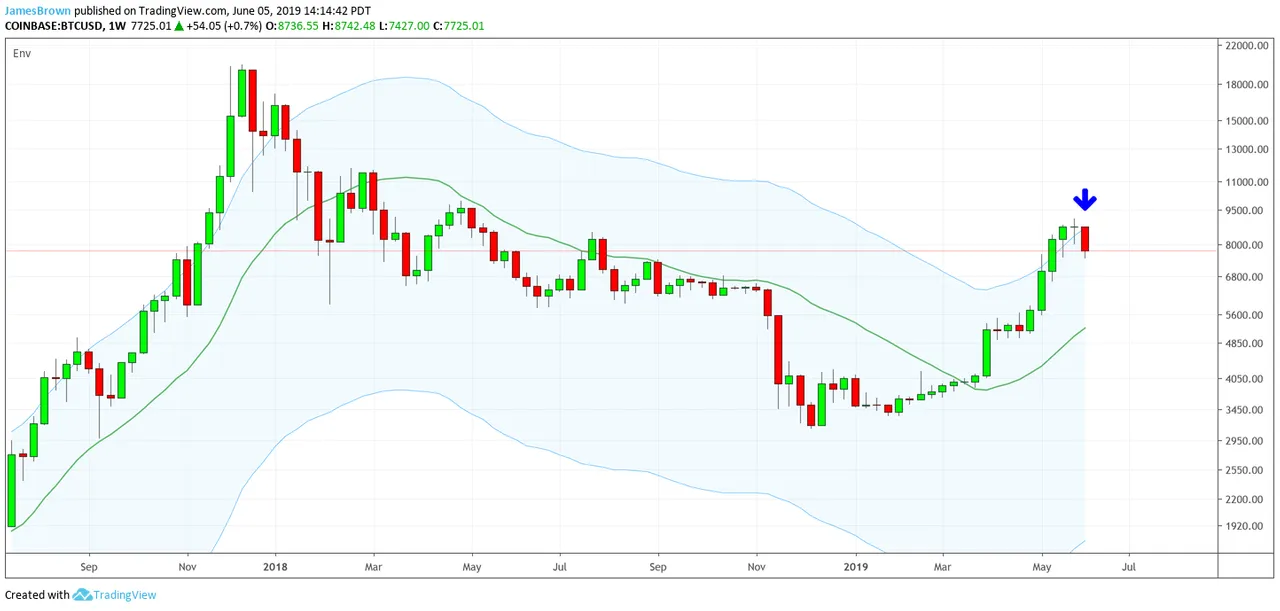
https://www.tradingview.com/x/Oh95omzH/
Looking under that big blue arrow we find the current weekly candle. Notice where it is in relation to the upper band?
Yeah, I notice it too, which is why I highlighted it.
The questions I pose to you, given my recent input on this specific moving average/ envelope set-up, are:
1.) should we be surprised that price is correcting to the extent that it has so far?
2.) should we be surprised if it continues to correct even further?
3.) where is a logical point for BTC to finish this downward movement in price?
And, just in case you've been sleeping through this monotone lecture...
I provide the the cheat-sheet:
1.) no
2.) no
3.) 20 WMA
You owe yourself a pat on the back if you got a 100% all on your own :)
Do with this info what you will...
But know that I am not a professional financial adviser and that I offer only my opinions and the suggestion that they (opinions) are generally worth less than two cents... and that's my two cents ;)