assumption: how far a divergence's impact goes? how deep or how high it sends the price?
this is a million dollar question!
look at below chart of Bitcoin weekly (which is HOT HOT HOT right now!)
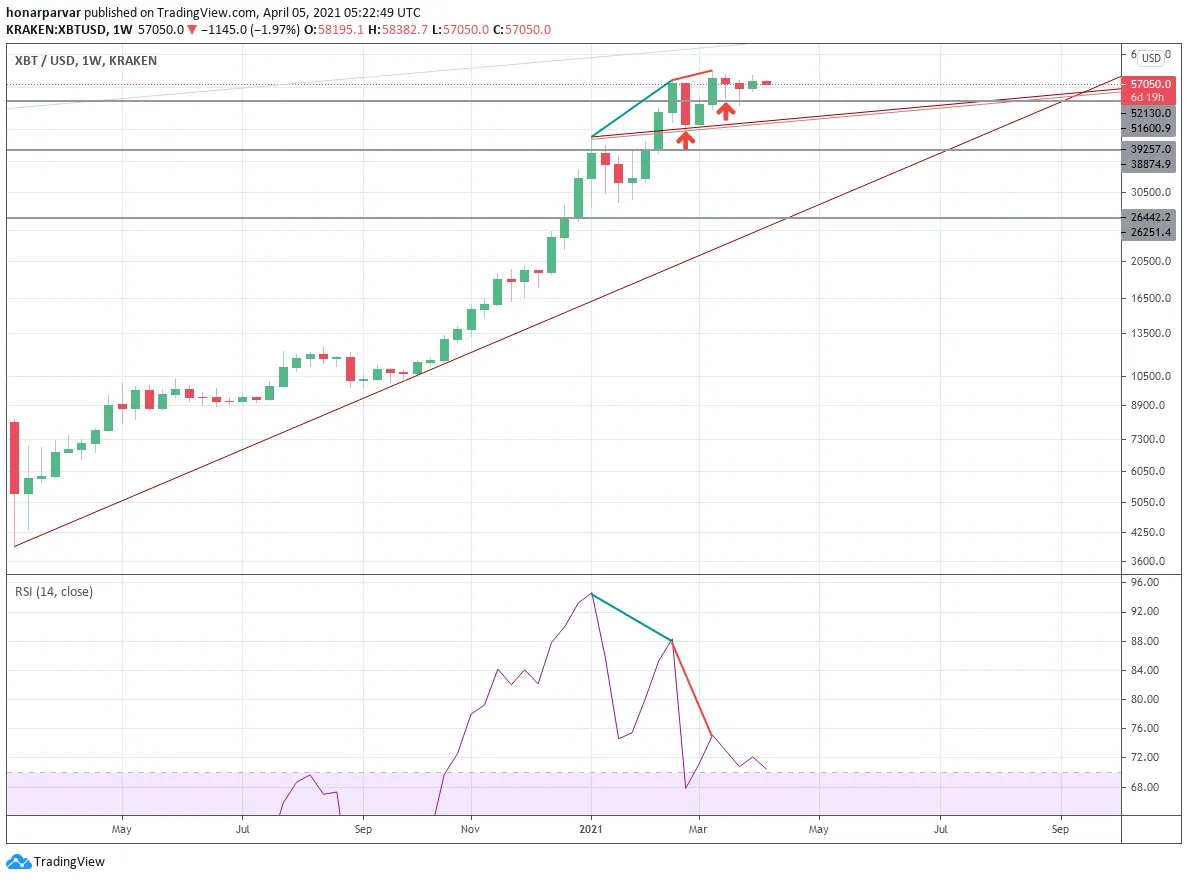
if you compare the first regular bearish divergence (the green lines on the price action and RSI)
with the
second regular bearish divergence (the red lines on the price action and RSI)
you will notice:
- the price within the 2nd Div., has lost momentum. it has a lower slope than previous one.
- the indicator's slope has risen.
- the impact of the first div. is much greater than the 2nd one (the very next red candles)
for me the conclusion is:
- I can't measure a div's impact with its characteristics
- after a div. the price action techniques are the best way to predict the lows. as you can see in the picture, two important lines have supported the drop.
there is another issue about divs that I think which I call it the domino effect. it looks the multi time frame divs. you can imagine what I mean but anyway I will put it in another post later.
cheers