SUMMARY
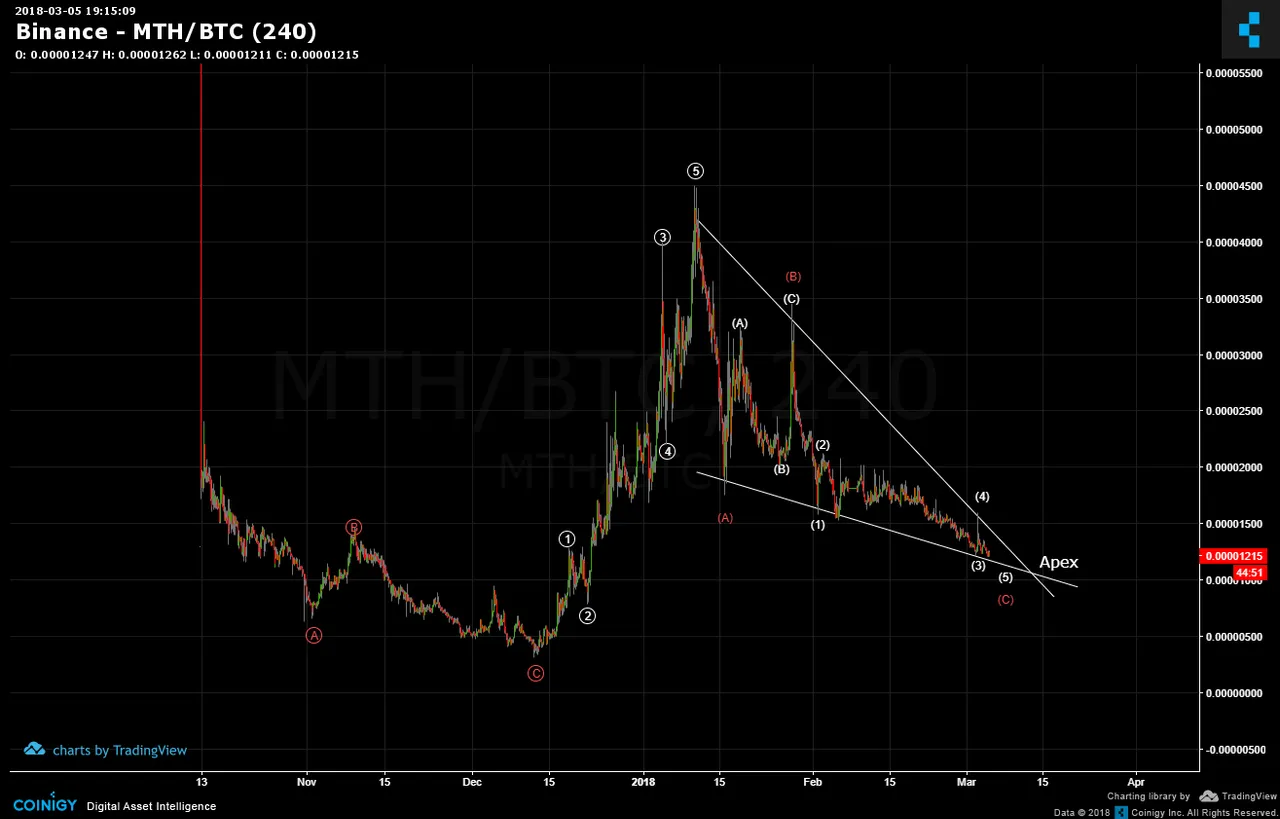
When a Technical Analyst sees a chart like the one below of Monetha (MTH/BTC); excitement arises. Why? Pattern and Count are displaying that MTH is nearing the terminal end of a correction and that is usually the best time to buy. My buy entries are made using laddered rungs where local suppport & resistance areas are used to identify a scaled entry program. The below chart shows an impulse five wave round completed and the red ABC is likely also complete given that the subwaves for C show 1,2,3,4,5. Price is also quite proximal to the Apex; making it very ripe and near to a breakout.
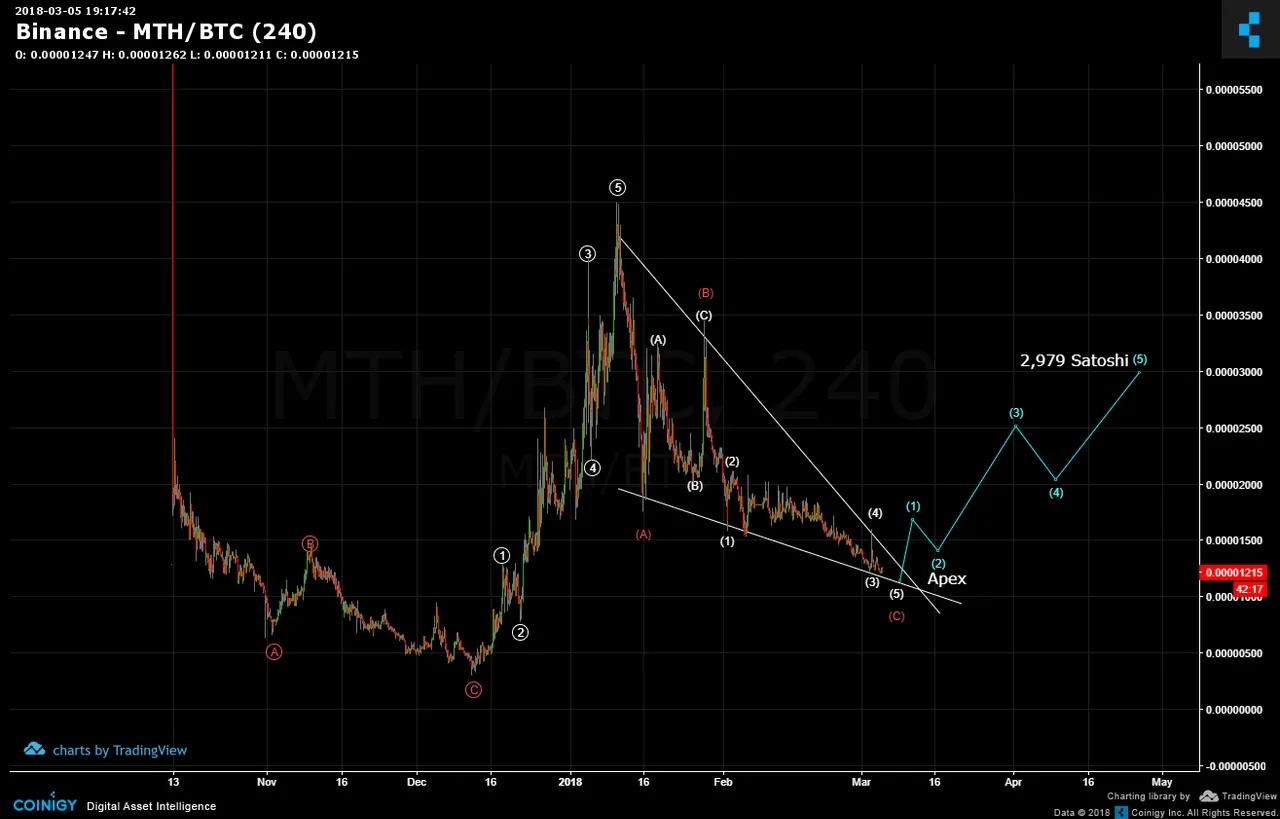
The projected breakout could look like the below chart where the blue waves show a target towards 2,979 Satoshi. Now, is this guaranteed? In a word, no. Such guarantees don't exist and profitable trading is based on calculated risk to reward assessments. As an analysts, the below represents an ideal ladder entry zone.
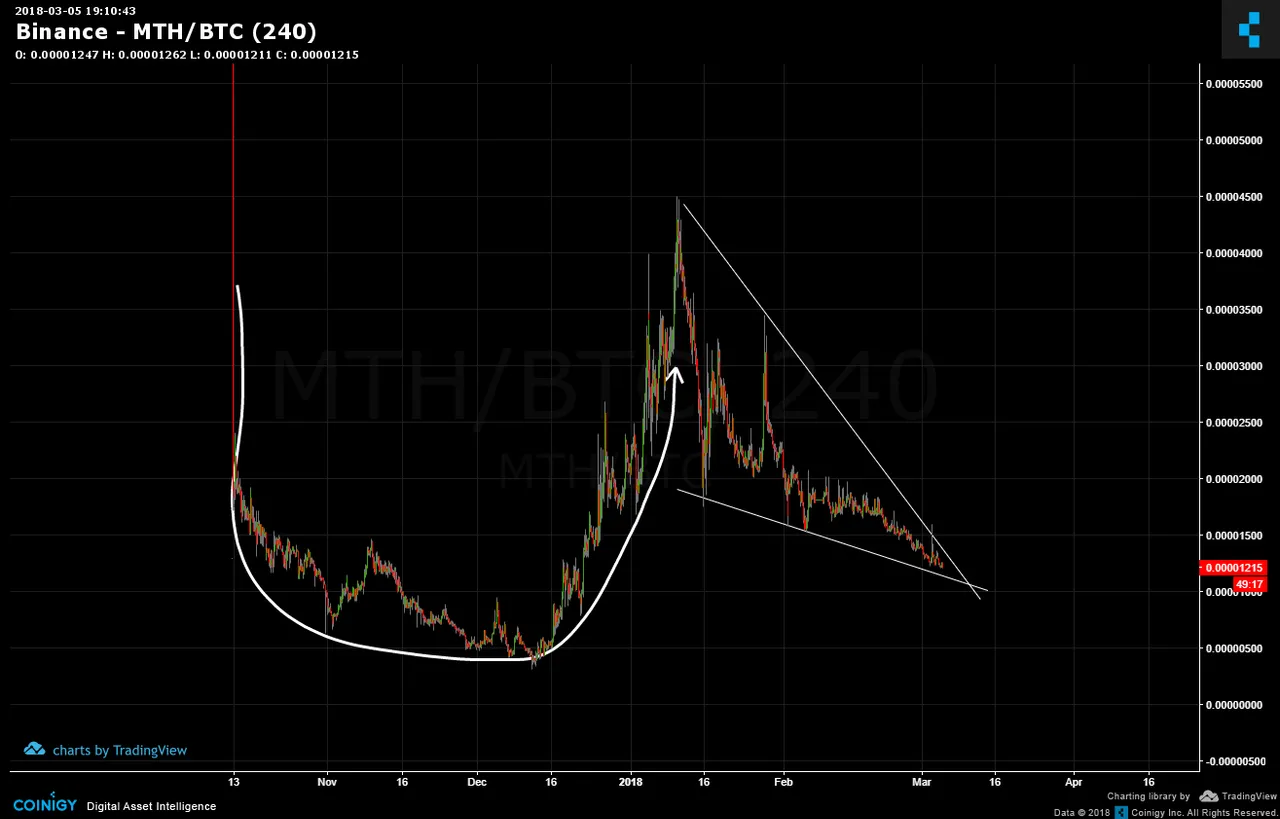
The overarching pattern is likely a Cup & Handle as shown. The handle is retraced nearly 0.618 Fib level and is so close to the apex, it's almost unstable.
Legal Disclaimer: I am not a financial advisor nor is any content in this article presented as financial advice. The information provided in this blog post and any other posts that I make and any accompanying material is for informational purposes only. It should not be considered financial or investment advice of any kind. One should consult with a financial or investment professional to determine what may be best for your individual needs. Plain English: This is only my opinion, make of it what you wish. What does this mean? It means it's not advice nor recommendation to either buy or sell anything! It's only meant for use as informative or entertainment purposes.
Please consider reviewing these Tutorials on:
Elliott Wave Counting Tutorial #1
Elliott Wave Counting Tutorial #2
Elliott Wave Counting Tutorial #3
Laddering and Buy/Sell Setups.
Laddering Example with EOS
Tutorial on the use of Fibonacci & Elliott Waves
@haejin's Trading Nuggets
Essay: Is Technical Analysis a Quantum Event?
Follow me on Twitter for Real Time Alerts!!
Follow me on StockTwits for UpDates!!
--
--

