
SUMMARY
Back two months ago, I had recommended Spread Coin when it was barely past $0.25 and had called the bottom at $0.19 to be in. This is the evidence of my performance...its ALL IN MY BLOGS!! I was criticized for making such a bullish projection because many thought SPR was a dead coin because its website had not been updated since 2016 and many other reasons. I disagreed because Technical Analysis used ONLY price data which is the most earliest and direct reflection of sentiment to forecast future price pathway. Elliott Waves states that after five waves, an a,b,c correction follows and I had determined that the correction was likely complete. The below chart was used:

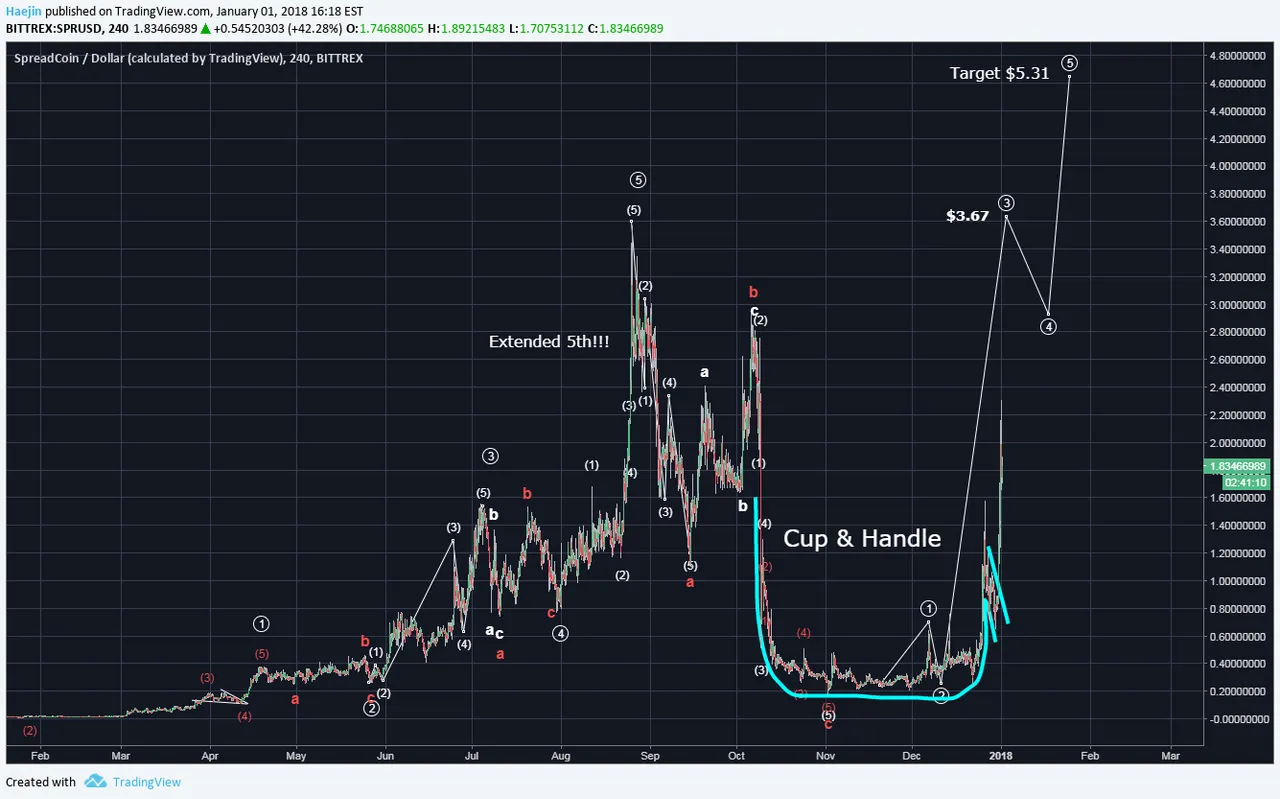
The current chart shows that SPR has surged as high as $2.32. The short term target is $3.67 and then $5.31. ALL TIME NEW HIGHS...DEAD AHEAD!!
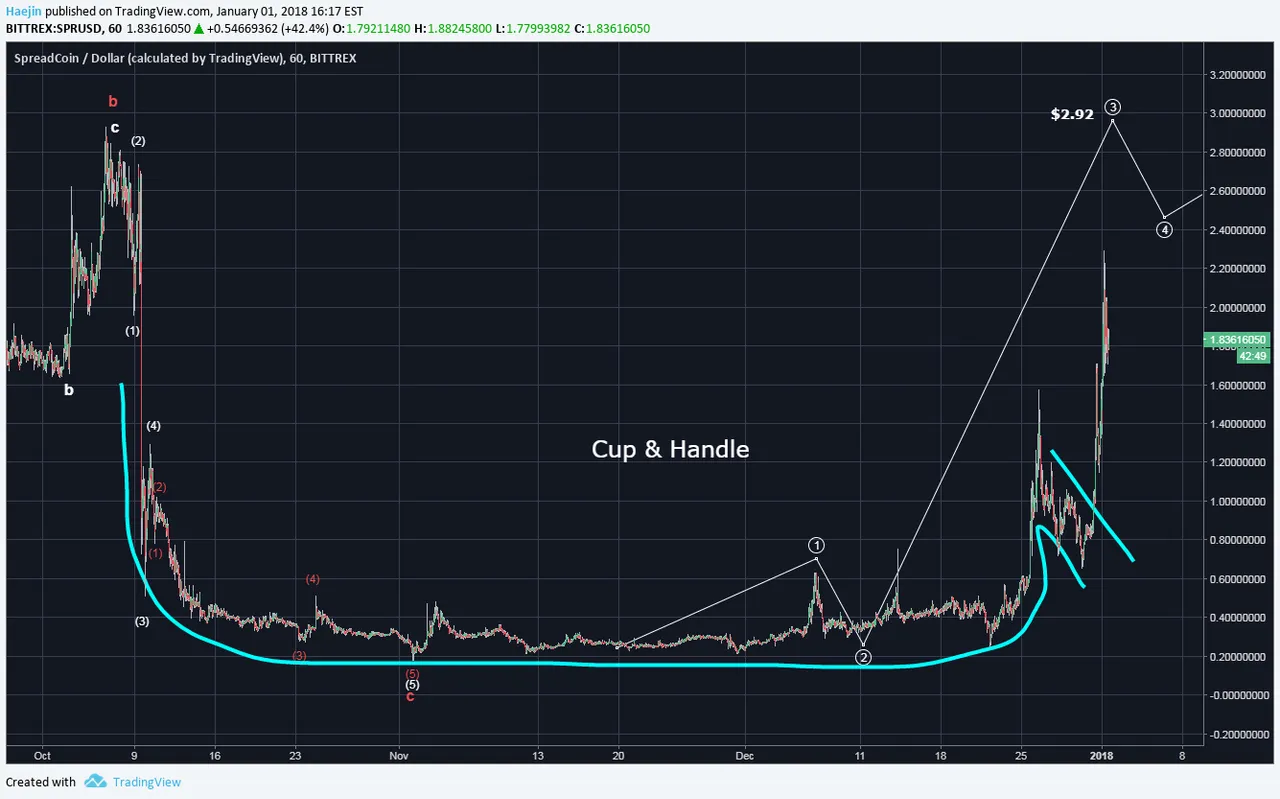
The below chart shows the longer term perspective and how Elliott Waves mold quite well with Chart Pattern Recognition. The Cup & Handle has been the guiding pattern for several weeks now and this enabled the awareness that a MASSIVE bull run was about to happen!
Below is that of the SPR/BTC pair and what a beauty! Dead Coin Walking the Stairways to MASSIVE PROFITS!! The Fractals indicate a highly bullish run to be expected. Yes, as usual, this SPR/BTC pair is lagging the SPR/USD pair. The first explosion has occurred and more rise to go. After a brief wave 2 interlay; I'm projecting 0.0009362 BTC!!
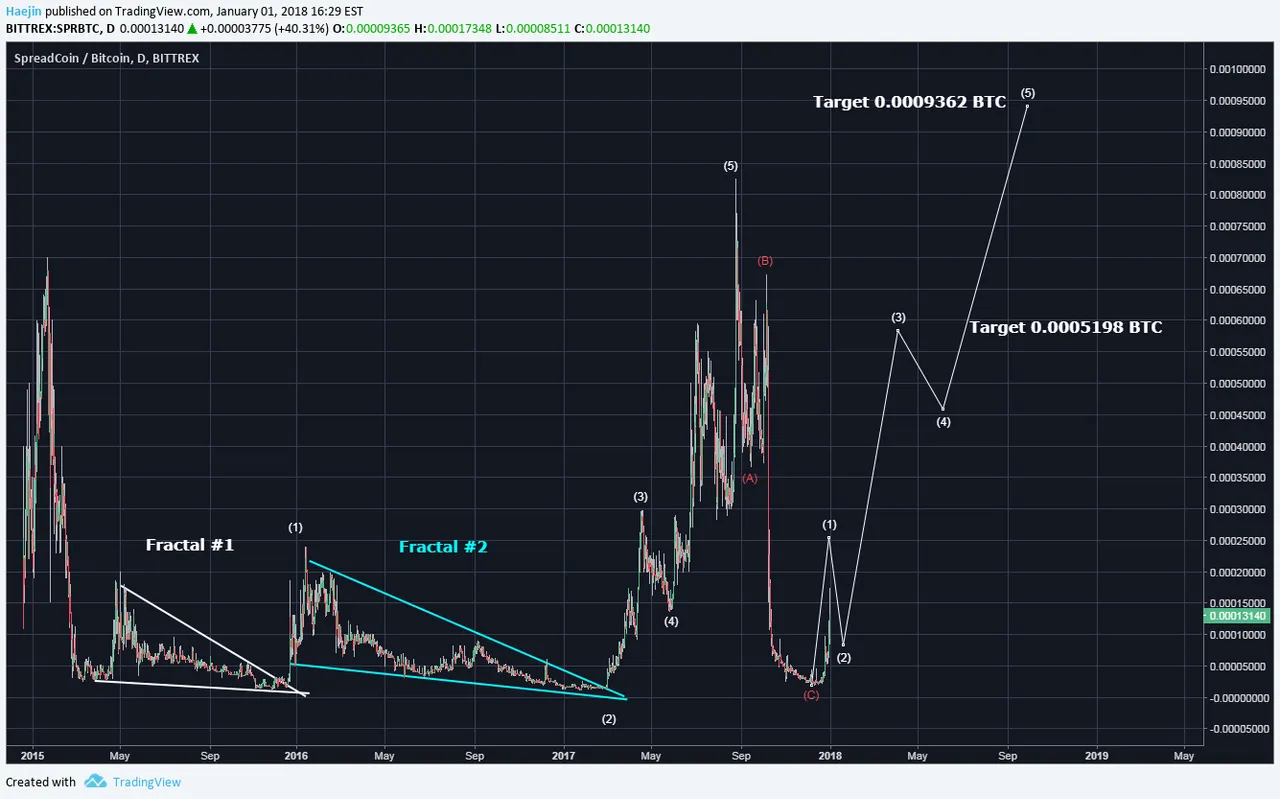
Note how the volume declined to a trickle as price approached the apex (the point where the two lines of the triangle cross). This completed the Bullish Ascending Right Triangle pattern. The rationale behind this decline in volume is based on the decline of overall sellers. As price approaches the apex, the degree of price movement contracts because the sellers are getting exhausted. As the Apex approaches closer, there remain almost no sellers except buyers and that is what explodes the price!!
Please consider reviewing these Tutorials on:
Elliott Wave Counting Tutorial #1
Elliott Wave Counting Tutorial #2
Elliott Wave Counting Tutorial #3
Laddering and Buy/Sell Setups.
Laddering Example with EOS
Tutorial on the use of Fibonacci & Elliott Waves
These Technical Analysis Books: Elliott Wave Priniciple & Technical Analysis of Stock Trends are highly recommended
@haejin's Trading Nuggets
Essay: Is Technical Analysis a Quantum Event?
Follow me on Twitter for Real Time Alerts!!
--

If this blog post has entertained or helped you to profit, please follow, upvote, resteem and/or consider buying me a beer:
BTS Wallet - haejin1970
BTC Wallet - 1HMFpq4tC7a2acpjD45hCT4WqPNHXcqpof
ETH Wallet - 0x1Ab87962dD59BBfFe33819772C950F0B38554030
LTC Wallet - LecCNCzkt4vjVq2i3bgYiebmr9GbYo6FQf

Legal Mumbo Jumbo: This is only my opinion, make of it what you wish. What does this mean? It means it's not advice nor recommendation to either buy or sell anything! It's only meant for use as informative or entertainment purposes.**