
SUMMARY
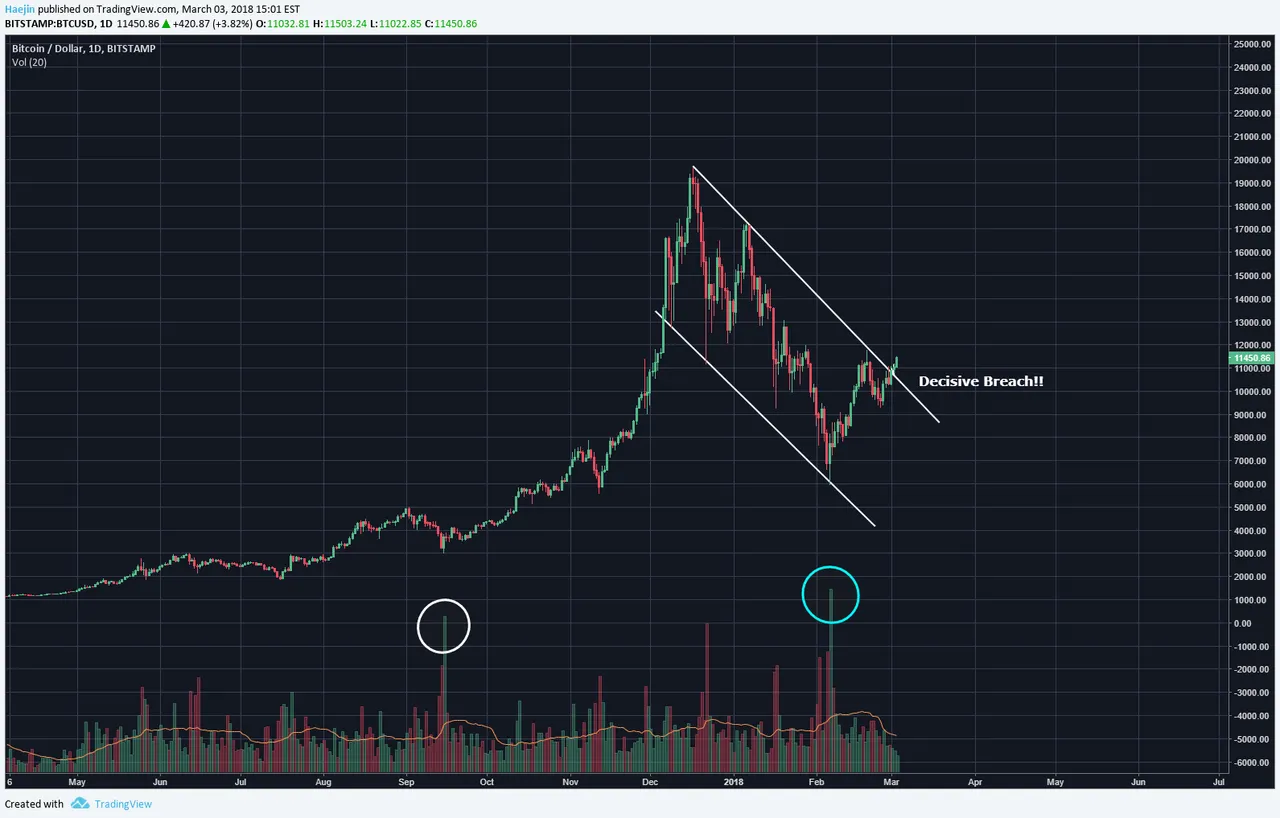
When Bitcoin (BTC) hit the $5,900 zone, there was a monstrous green volume on a daily scale (blue circle) and this was quite a bullish sign being born in the midst of panic selling. A similar event occured back during the September correction where then too, a monstrous daily green volume was seen to provide the impetus for a trend reversal from down to up. Price has since $5,900 decisively breached the upper white trend line resistance. So, the primary count is up.
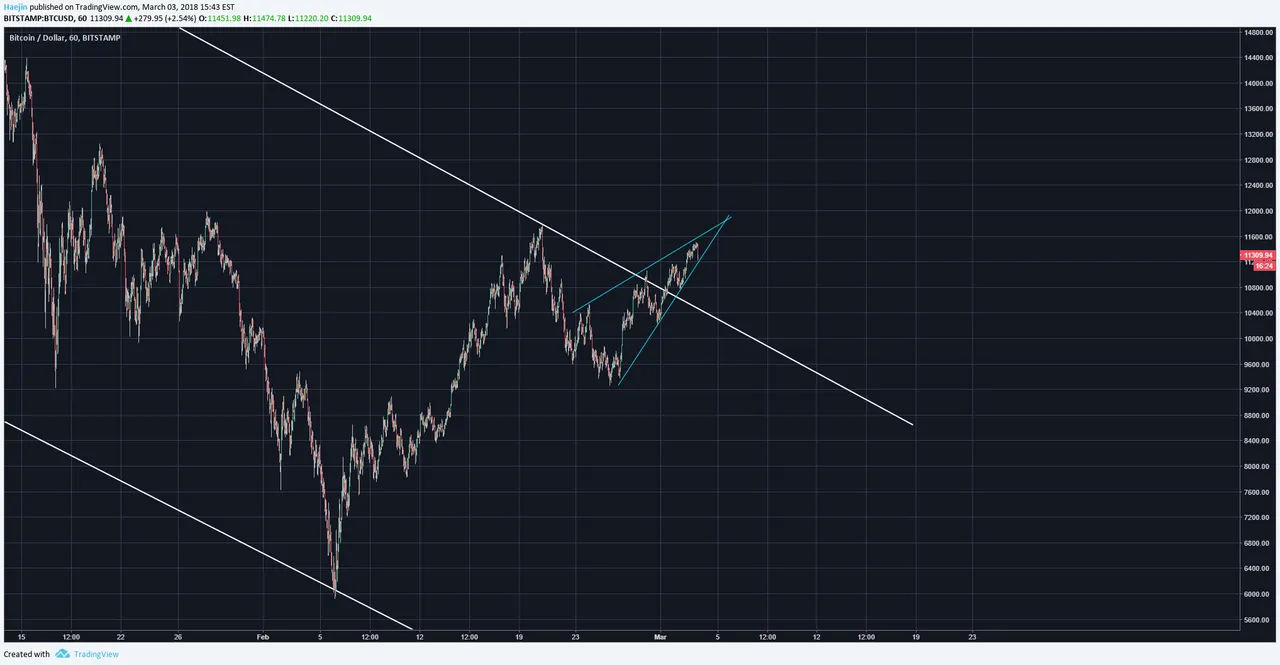
On the short term, the upward pointing wedge could be signaling a minor correction; perhaps back towards the white trend line. What really shouldn't happen is that price re-enter below the white line because then we've got a different scenario. Nothing to get nervous about; only to be aware!
Legal Disclaimer: I am not a financial advisor nor is any content in this article presented as financial advice. The information provided in this blog post and any other posts that I make and any accompanying material is for informational purposes only. It should not be considered financial or investment advice of any kind. One should consult with a financial or investment professional to determine what may be best for your individual needs. Plain English: This is only my opinion, make of it what you wish. What does this mean? It means it's not advice nor recommendation to either buy or sell anything! It's only meant for use as informative or entertainment purposes.
Please consider reviewing these Tutorials on:
Elliott Wave Counting Tutorial #1
Elliott Wave Counting Tutorial #2
Elliott Wave Counting Tutorial #3
Laddering and Buy/Sell Setups.
Laddering Example with EOS
Tutorial on the use of Fibonacci & Elliott Waves
@haejin's Trading Nuggets
Essay: Is Technical Analysis a Quantum Event?
Follow me on Twitter for Real Time Alerts!!
Follow me on StockTwits for UpDates!!
--
--

