CryptoKraze Technical Analysis

Possibility on 1 Hour Chart
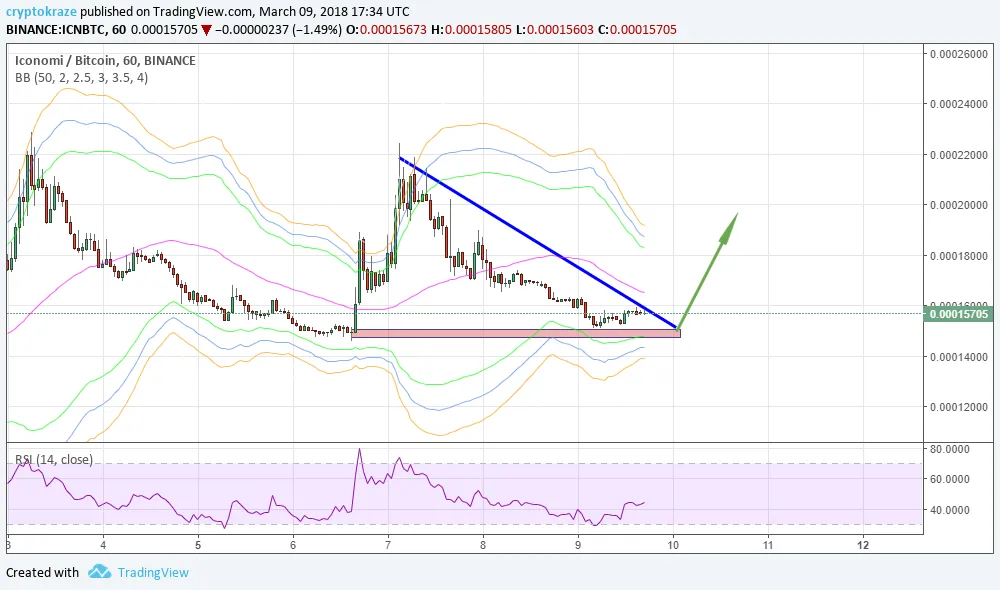
If you look at 1 hour chart, you will see $TX has formed a descending triangle and likely to breakout. This is very common pattern in cryptocurrencies, whenever a coin makes this descending triangle, a breakout is imminent that might happen anytime soon. If we look at RSI, it has touched 70 level and has dipped below 50 level. It has to rise up to touch 70 level again.
- I would have a buy entry at 0.00015000 with my profit target around 0.00019500 or above.
- Stop loss just below the entry area is must for trading if you don't know the Averaging Technique in Crypto Trading.
Crypto Trading is risky business and you can loss partial or full amount of money. Trade at your own risk with that money only you can afford to lose. Bitcoin unexpected move will make this analysis void.

Steem Education Initiative is empowering local students of Pakistant through Steem blockchain to give them a chance for better life.
Join SEI at Discord

Follow ADSactly at Discord