Thanks for tuning to todays April 11th Quick Charts Report with Michael Alexander!
Very briefly...What is Quick Charts and why was it created?
(1) Quick Charts was created as an data analytics tool to save you many hours of research and time to know what the top analysts are predicting about the next bitcoin price.
(2) Quick Charts allows you to see many top analysts all in one page to get an idea of where the next major price point will be and also to make sure you don't miss out on the next major price move.
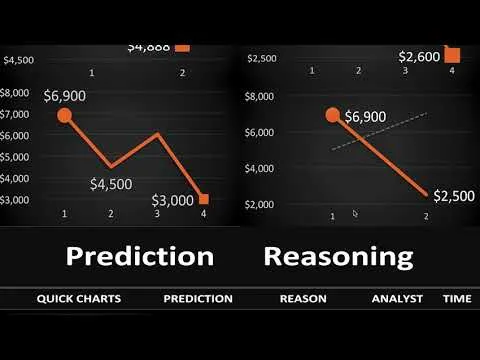
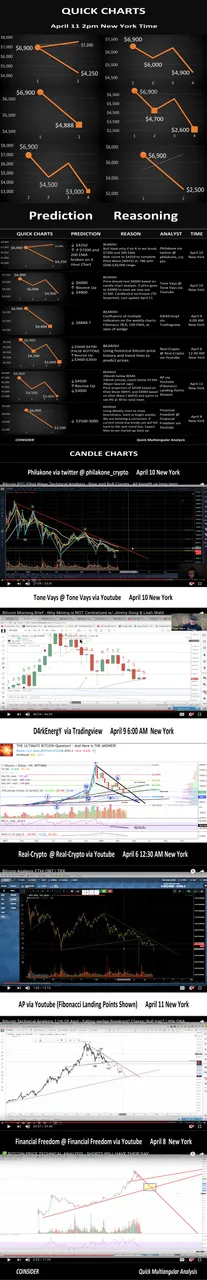
In todays report we have 6 bitcoin analysts. They are all bearish. Three are prediction Bitcoin will have its final correction around the $3000 zone. The other three see the next major move around the $5000 zone.
So what do you think it will be...$5000 or $3000?
Comment below and let us know your thoughts on which analysts you believe may be right and your thoughts on where the bottom may end up being.
Thanks again for tuning in with Coinsider and see you on the next Quick Charts Video!
 ##
##
 ##
##
Disclaimer: We are not financial advisors as all content in this post is for informational and entertainment purposes only.