Analysis Summary:
Hi Friends, welcome to this TA update of bitcoin,
If you follow my post you must be knowing about the trap for bears that I described two posts earlier in the form of inverse Head and shoulders which I had also drawn on the chart,
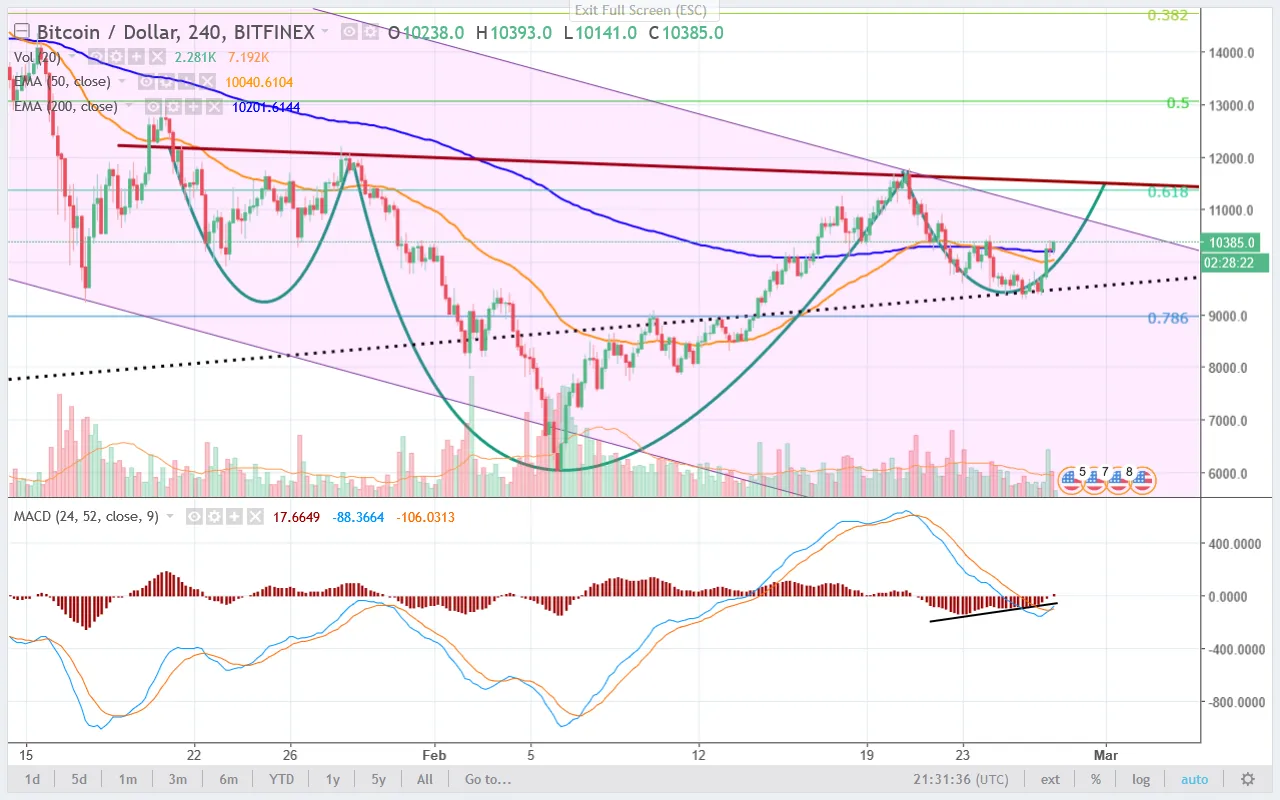
you can see on the 4 hour chart that, BTC got some crucial support at the black dotted trend line which originates at beginning of BTC rally back in September 2017.this bounce was something that I was counting on to happen since I posted last time. I wanted this to happen before posting further and here I am with my next analysis.
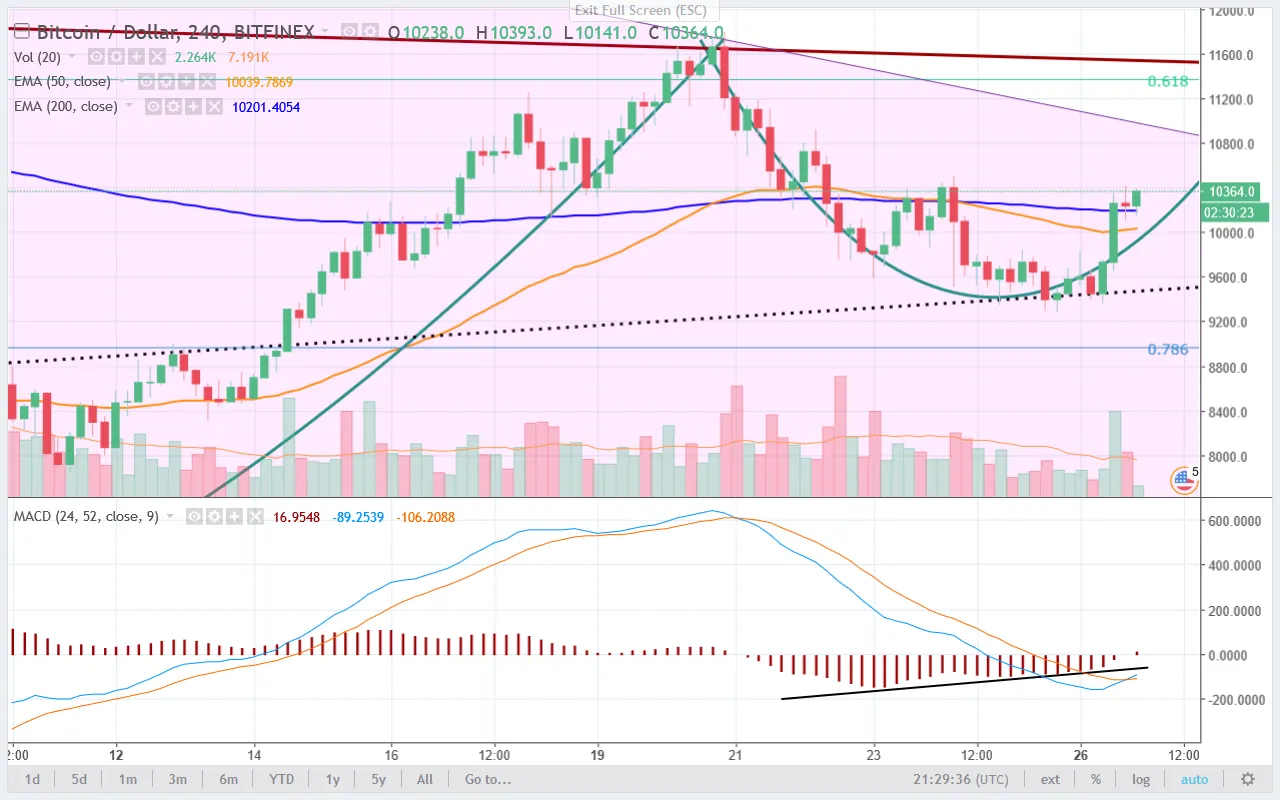
Since then BTC has also broken above both EMA50 (orange) and EMA200 (blue) in one go just like the bears did two days earlier, Both these levels generally tend to be strong resistances and BTC already failed multiple times before breaking above these levels before succeeding so it was relieving to see both these levels broken easily. and in the meantime the right shoulder of the inverse H&S pattern has taken shape by this movement to upside.
Since BTC is now above both these levels, both these can be expected to provide support, and EMA200 just behaved like one by holding BTC once from falling already. If you remember I slowed down my MACD in my last analysis and that gave me a prior indication that a bounce is near which I informed to you guys in my last post.
That bullish MACD signal was further strengthened when BTC formed a lower low again on the chart than the one I pointed out in my last post but it was again unable to form a lower low on MACD which was somewhat indication that Bears have depleted their battery and Bulls came raging afterwards.
On the upside we can see that the Top of pink downward channel is near and it should be the next stop for BTC but I think a slight hold will occur at the breakout point of inverse H&S pattern, if BTC breaks above that level significantly, which so far BTC is looking to manage easily, will be sign of a full bullish market and levels around $15000 will again be in its sight. However the target calculated from the size of inverse H&S is much higher than that.
So people keep watching for any signs on MACD front, if there will be any change of direction, MACD will surely issue a warning, on the downside we can see that EMA200 AND EMA50 are again strong supports as well as the dashed black trendline where the BTC regained the upward momentum .
That will be all for now, I will keep you guys Posted in the as the chart develops further.
Till then Goodbye and Best of Luck to You People.