Lets quickly review the outlook from my previous post:
"Bottomline: Opportunities are definitely there for Steem price to reverse upwards, although there is a higher likelihood that it will still need to retest lower first before bargain hunting kicks back in and get the rebound going. I would be taking the patient approach to join these anglers for now."
Well, it did head lower, much lower in fact. It penetrated the previous support low at 0.0009 without much effort - any bargain hunting actions there would have been overwhelmed by the stronger sell-off resulting in a new low of 0.000787. From there, It retraced back up above the 0.0008 levels where it is currently trading at the moment, undergoing consolidation.
Does this latest swing low reflect price capitulation yet? Let's review the charts 1st.
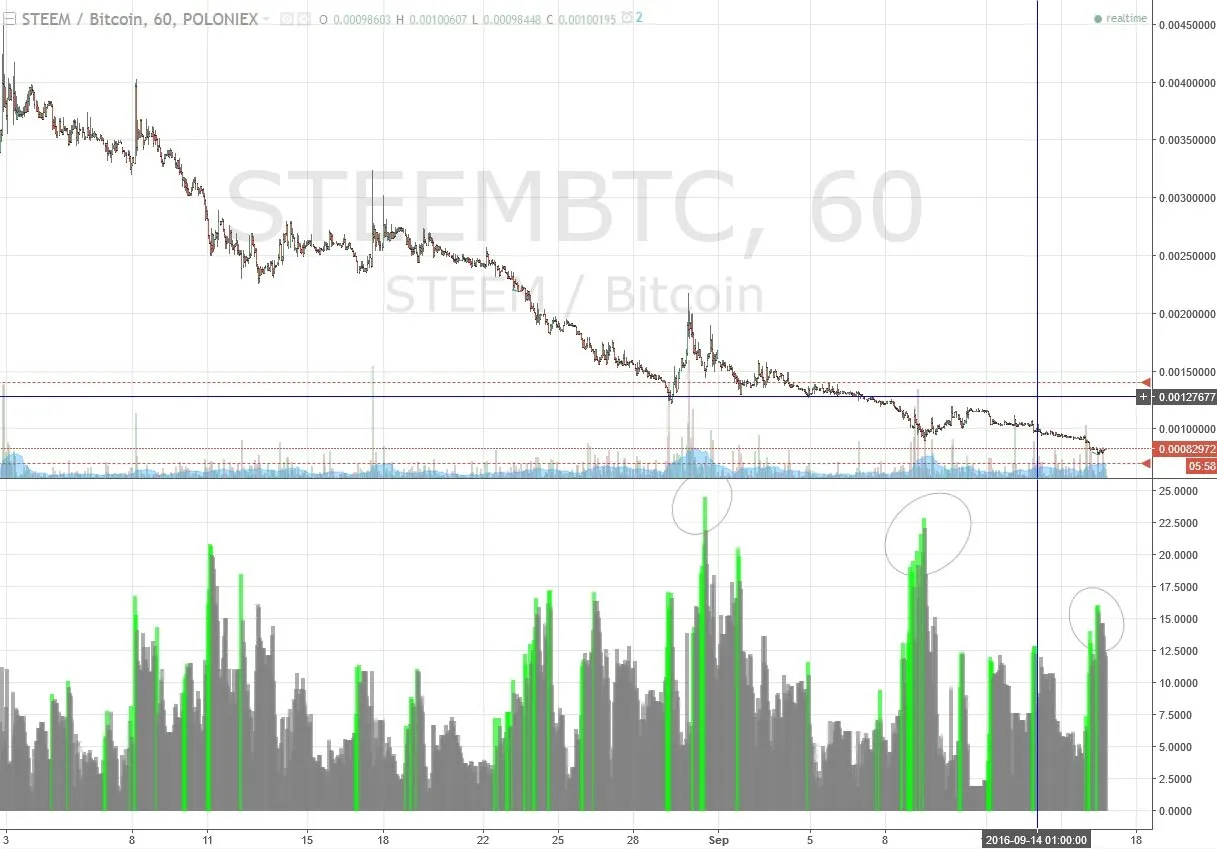
Direction: We currently see some divergence in price trend (lower candle lows to flats) vs indicator trend (higher candle lows) at this latest swing low formation, evident from the current retracement seen. The question is if this new low is now complete and retracement action continues to push price back up further.

Probability: Strength indicators reflect a further oversold situation but this has also bounced off the lows and is now attempting to cross over to neutral territory. Momentum-wise, this is still in the red zone.
Looking at the volatility indicator which provides signs of sell-off capitulation, we see a number of green bars exceeding a decent 15 - which re-affirms an oversold situation, not necessarily capitulation just yet. -For STEEM's normal higher level of volatility, i would like to see an excess of 22 before able to conclude with a high level of comfort that a capitulation has likely occurred.
Support & resistance: Current price reflects no man's land and due to lack of historical volume data for Poloniex, it is no longer feasible to use volume profile to derive S&R levels. The best we can do at the moment is to utilise a rudimentary Bitrex chart with better historical data and try to assess where the next congestion points converge to infer a new support level.
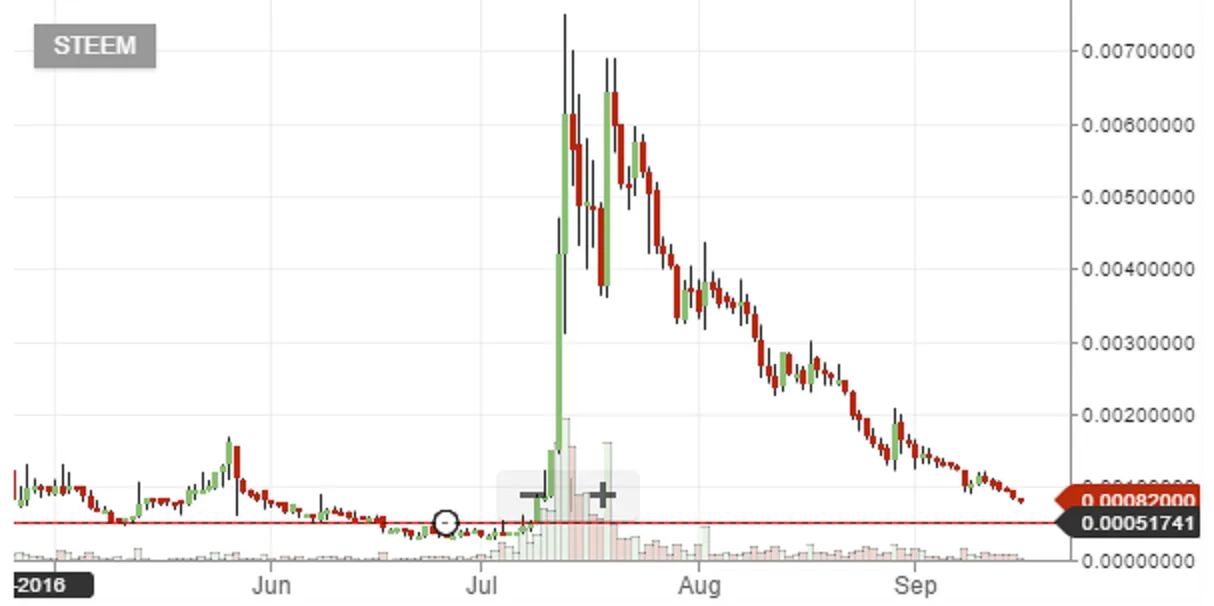
From here we see previous multiple highs and lows way back before the huge up-spikes, converging at around 0.00052 levels which leads me to identify this as the next support level. Resistance remains at previous 0.00092 (below cloud entry) and further up at 0.00104 after that.
Bottomline: Although we seem to see some signs of bottoming at the moment, I doubt capitulation has occurred at this time - which means STEEM/BTC could continue its downward descent after this retracement has run out of steem.
In terms of disclaimers: these are just my own views and I will not be responsible for any trades that you may end up taking based on them. You are ultimately responsible for all your trading actions.
In terms of disclosures: I currently have a long STEEM/BTC position which i may add to it when signs of capitulation based on chart signals emerges.
Appreciate any thoughts, comments, upvotes :)