A few comments from Steven Kopits of Princeton Energy Advisors LLC on Jan 26, 2017:
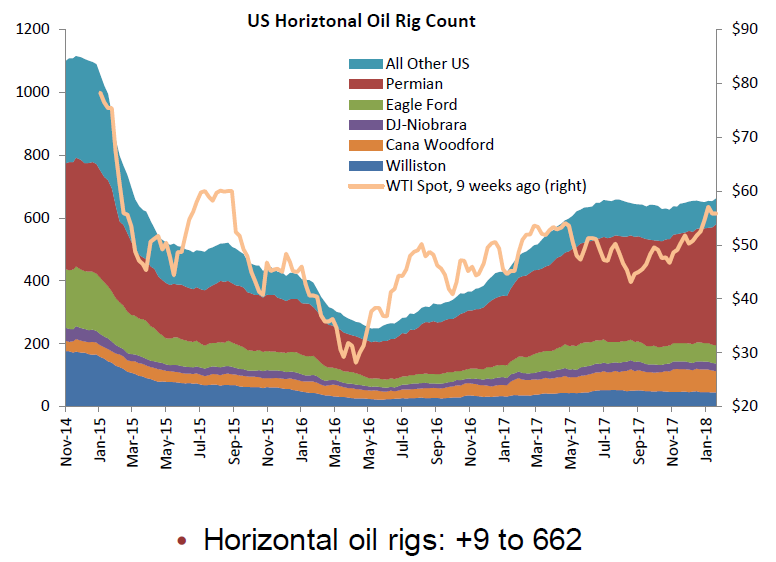
• Total US oil rigs were up sharply, +12 to 759
• Horizontal oil rigs were similarly up, +9 to 662
• All of the gain comes from the Permian, up 18 rigs in total ... • The oil price continues to rise, with WTI above $66, even as the Brent spread has fallen below $5.
Click on graph for larger image.
CR note: This graph shows the US horizontal rig count by basin.
The Federal Reserve Bank of Philadelphia has released the coincident indexes for the 50 states for December 2017. Over the past three months, the indexes increased in 42 states and decreased in eight, for a three-month diffusion index of 68. In the past month, the indexes increased in 37 states, decreased in 10, and remained stable in three, for a one-month diffusion index of 54. emphasis added
Note: These are coincident indexes constructed from state employment data. An explanation from the Philly Fed:
The coincident indexes combine four state-level indicators to summarize current economic conditions in a single statistic. The four state-level variables in each coincident index are nonfarm payroll employment, average hours worked in manufacturing by production workers, the unemployment rate, and wage and salary disbursements deflated by the consumer price index (U.S. city average). The trend for each state’s index is set to the trend of its gross domestic product (GDP), so long-term growth in the state’s index matches long-term growth in its GDP.
Click on map for larger image.
Here is a map of the three month change in the Philly Fed state coincident indicators. This map was all red during the worst of the recession, and all or mostly green during most of the recent expansion.
Recently several states have turned red.
Source: Philly Fed.
Note: For complaints about red / green issues, please contact the Philly Fed.
And here is a graph is of the number of states with one month increasing activity according to the Philly Fed. This graph includes states with minor increases (the Philly Fed lists as unchanged).
In December, 38 states had increasing activity (including minor increases).
The downturn in 2015 and 2016, in the number of states increasing, was mostly related to the decline in oil prices.
The reason for the mid-to-late 2017 sharp decrease in the number of states with increasing activity is unclear.
The first graph below shows the contribution to GDP from residential investment, equipment and software, and nonresidential structures (3 quarter trailing average). This is important to follow because residential investment tends to lead the economy, equipment and software is generally coincident, and nonresidential structure investment trails the economy.
In the graph, red is residential, green is equipment and software, and blue is investment in non-residential structures. So the usual pattern - both into and out of recessions is - red, green, blue.
The dashed gray line is the contribution from the change in private inventories.
Click on graph for larger image.
Residential investment (RI) increased at a 11.6% annual rate in Q3. Equipment investment increased at a 11.4% annual rate, and investment in non-residential structures increased at a 1.4% annual rate.
On a 3 quarter trailing average basis, RI (red) is unchanged, equipment (green) is positive, and nonresidential structures (blue) is unchanged.
Recently RI has been soft, but picked up in Q4.
I'll post more on the components of non-residential investment once the supplemental data is released.
The second graph shows residential investment as a percent of GDP.
Residential Investment as a percent of GDP increased in Q4, and has generally been increasing. RI as a percent of GDP is only just above the bottom of the previous recessions - and I expect RI to continue to increase for the next couple of years.
The increase is primarily coming from single family investment and the boom in home remodeling.
I'll break down Residential Investment into components after the GDP details are released.
Note: Residential investment (RI) includes new single family structures, multifamily structures, home improvement, broker's commissions, and a few minor categories.
The third graph shows non-residential investment in structures, equipment and "intellectual property products". Investment in equipment - as a percent of GDP - picked up.
Real gross domestic product (GDP) increased at an annual rate of 2.6 percent in the fourth quarter of 2017, according to the "advance" estimate released by the Bureau of Economic Analysis. In the third quarter, real GDP increased 3.2 percent. ... The increase in real GDP in the fourth quarter reflected positive contributions from personal consumption expenditures (PCE), nonresidential fixed investment, exports, residential fixed investment, state and local government spending, and federal government spending that were partly offset by a negative contribution from private inventory investment. Imports, which are a subtraction in the calculation of GDP, increased.
The deceleration in real GDP growth in the fourth quarter reflected a downturn in private inventory investment that was partly offset by accelerations in PCE, exports, nonresidential fixed investment, state and local government spending, and federal government spending, and an upturn in residential fixed investment. Imports, which are a subtraction in the calculation of GDP, turned up. emphasis added
The advance Q4 GDP report, with 2.6% annualized growth, was below expectations.
Personal consumption expenditures (PCE) increased at 3.8% annualized rate in Q4, up from 2.2% in Q3. Residential investment (RI) increased at a 11.6% pace. Equipment investment increased at a 11.4% annualized rate, and investment in non-residential structures decreased at a 1.4% pace.
Friday: • At 8:30 AM ET, Gross Domestic Product, 4th quarter 2017 (Advance estimate). The consensus is that real GDP increased 2.9% annualized in Q4, down from 3.2% in Q3.
• Also at 8:30 AM, Durable Goods Orders for November from the Census Bureau. The consensus is for a 0.8% increase in durable goods orders.
The advance estimate of Q4 GDP will be released tomorrow, Friday, January 26th. The consensus is that real GDP increased 2.9% annualized in Q4, down from 3.2% in Q3.
Here are a couple of estimates, from the Altanta Fed: GDPNow
The final GDPNow model forecast for real GDP growth (seasonally adjusted annual rate) in the fourth quarter of 2017 is 3.4 percent on January 25, unchanged from January 18.