I found out the relationship between price of HIVE and SOLANA is useful to for prediction analysis. This analysis uses linear regression to estimate a model for HIVE price when that of SOLANA is known. It is also useful in telling if the next bullish season for SOLANA will also replicate on Hive.
I consider the following subtitles relevant for this analysis.
A Brief Summary Of Model
As stated earlier SPSS presents a linear model for this analysis which shows it accepts the price of SOLANA in order to estimate the price of HIVE.
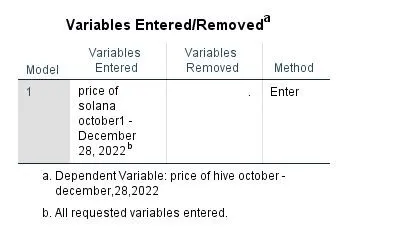
The model summary is presented below.
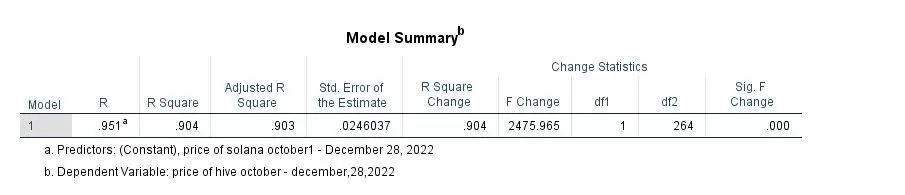
Considering the adjusted R square column it signifies that the model explains 90% of variance in the price of HIVE. In order words the model will estimate a figure for HIVE price which is 90% closer to the real life price.
Factors To Consider Before Predictive Analysis
According to the law of prediction, it is essential to consider if there is a linear relationship between the two variables. Linear relationship identifies the type of relationship present between the two.
From the table below, considering the correlation row and the point of intersection between HIVE and SOLANA, there seems to be a coefficient of relationship (0.95).
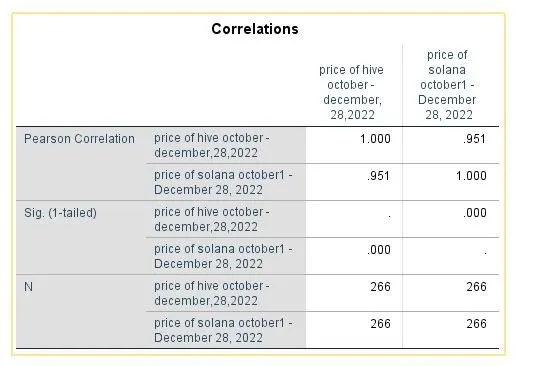
This tells that there is a positive relationship between the price of SOLANA and that of HIVE, How does this makes sense? It means in the crypto market if the price of SOLANA experiences a rise, same will be reflected on the HIVE block chain and if reverse is the case, same will also be reflected for HIVE.
Secondly, It is also important to satisfy the condition of normality. The normality test satisfies if the endogenous variable (price of HIVE) is gotten from a sample population.
It presents this using histogram chart and P-P plot.
If the histogram “n” curve is normal then the variable to be predicted is normal which means it’s been drawn from the population of crypto market.
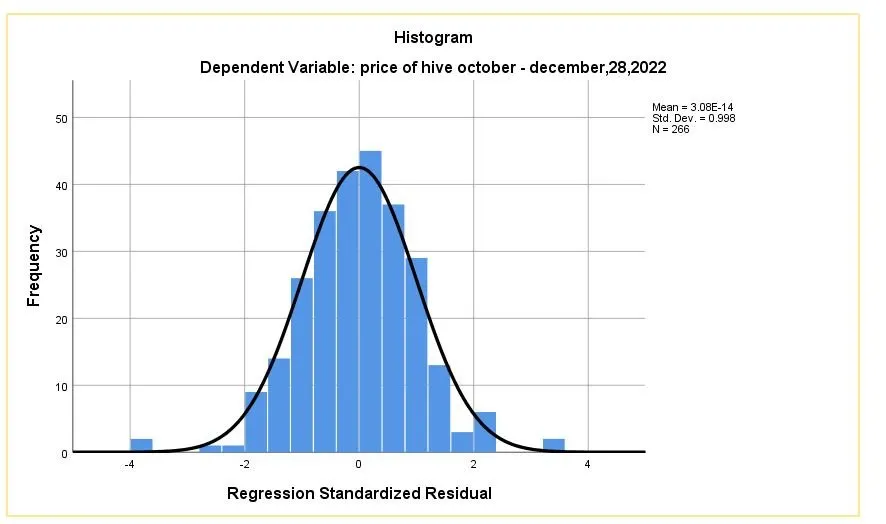
But if the “n” curve deviates from the normal then variable wasn’t drawn from the population.
I will also confirm this hypothesis using the P-P plot.
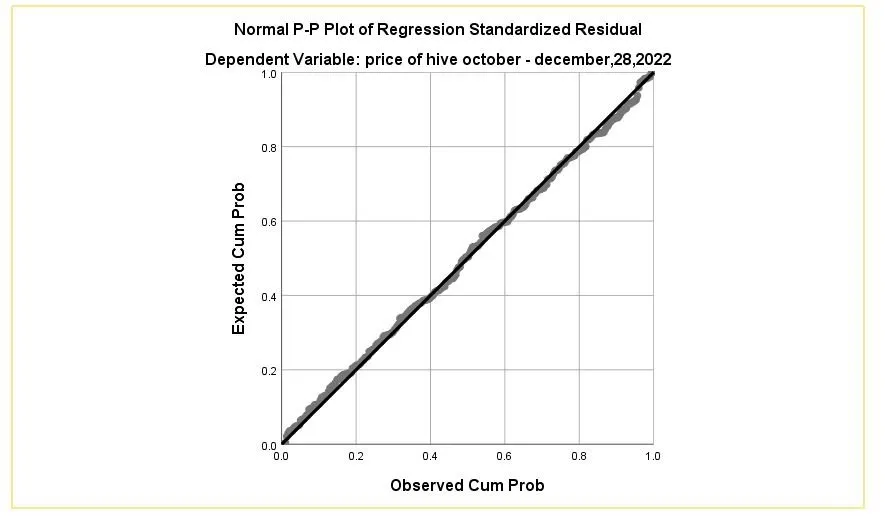
The plot speculates if the points follows the straight line, then the data is normal and if it doesn’t, there is a deviation from normality.
From the plot, it can be visualized the data points follows the straight line hence, the price of HIVE is normally distributed and it is reliable for prediction.
Estimated Model For Predicting HIVE Price Using SOLANA Price
The model for predicting the analysis can be extracted from the image below.
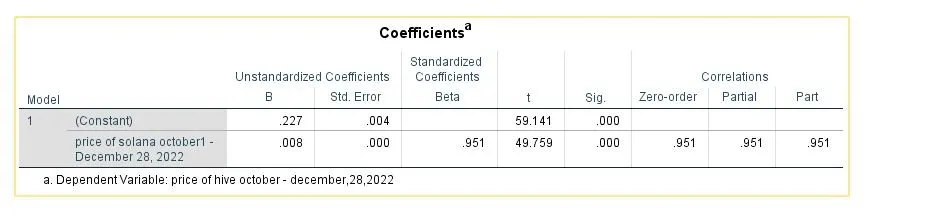
Considering the unstandardized B column the model is estimated as thus;
Price of HIVE = 0.227 + 0.008 * price of SOLANA
This model will be tested as seen below, on the 28th of December, 2022 when the price of SOLANA was $9.94.
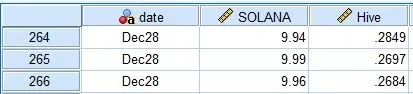
Price of HIVE = 0.227 + 0.008 * price of SOLANA
Price of HIVE = 0.227 + 0.008 * 9.94
Price of HIVE = 0.227 + 0.0795
Price of HIVE = $0.3065
However this is a closer estimation to the actual price of HIVE with a difference of $0.0216 which accounts for 10% of the adjusted R Square rating.
When the price of SOLANA estimates $1000, using same model for prediction, the price of HIVE will be $8.227 approximately.
Thanks for reading, I will like to call on @erikah, one of my friends on hive to please spare time and help me out on corrections. Thanks for your time.