Monday: • At 8:30 AM ET, Personal Income and Outlays for December. The consensus is for a 0.3% increase in personal income, and for a 0.5% increase in personal spending. And for the Core PCE price index to increase 0.2%.
• At 10:30 AM, Dallas Fed Survey of Manufacturing Activity for January. This is the last of the regional surveys for January.
Oil prices were up over the last week with WTI futures at $66.24 per barrel and Brent at $60.47 per barrel. A year ago, WTI was at $53, and Brent was at $55 - so oil prices are up solidly year-over-year.
Here is a graph from Gasbuddy.com for nationwide gasoline prices. Nationally prices are at $2.57 per gallon. A year ago prices were at $2.27 per gallon - so gasoline prices are up 30 cents per gallon year-over-year.
The Wards Intelligence January forecast calls for 1.16 million LVs to be delivered over 25 selling days, resulting in a 46,430-unit daily sales rate compared with 47,442 in prior-year (24 days). The DSR is down 2.1% from like-2017. ... The resulting seasonally adjusted annual rate is 17.24 million units, below the 17.75 million in the previous month and 17.34 million year-ago. emphasis added
Sales had been below 17 million SAAR (Seasonally Adjusted Annual Rate) for six consecutive months last year, until September, when sales increased due to buying following Hurricane Harvey. If sales exceed 17 million SAAR in January, this will be the fifth consecutive month over 17 million SAAR. However, overall, it appears sales will be down again in 2018.
Here is a table of light vehicle sales since 2000. The record year for sales was 2016, followed by 2015, both breaking the previous record set in 2000. Last year, 2017, was the fourth best year ever, just ahead of 2001.
Here are the monthly changes and a few comments from surferdude808:
Update on the Unofficial Problem Bank List for January 2018. The list had a net decline of two insured institutions to 101 banks. Likewise, aggregate assets had a small decline of $200 million to $20.7 billion. A year ago, the list held 163 institutions with assets of $43.5 billion.
Actions were terminated against First South Bank, Spartanburg, SC ($238 million) and Blue Grass Federal Savings and Loan Association, Paris, KY ($33 million). Heartland Bank, Little Rock, AR ($182 million) found their way off the list through a merger partner. Added this month was Jackson County Bank, Black River Falls, WI ($253 million).
The key report this week is the January employment report on Friday.
Other key indicators include the January ISM manufacturing index, January auto sales, and the Case-Shiller house price index.
Also the FOMC meets this week, and no change to policy is expected.
----- Monday, Jan 29th -----
8:30 AM: Personal Income and Outlays for December. The consensus is for a 0.3% increase in personal income, and for a 0.5% increase in personal spending. And for the Core PCE price index to increase 0.2%.
10:30 AM: Dallas Fed Survey of Manufacturing Activity for January. This is the last of the regional surveys for January.
----- Tuesday, Jan 30th-----
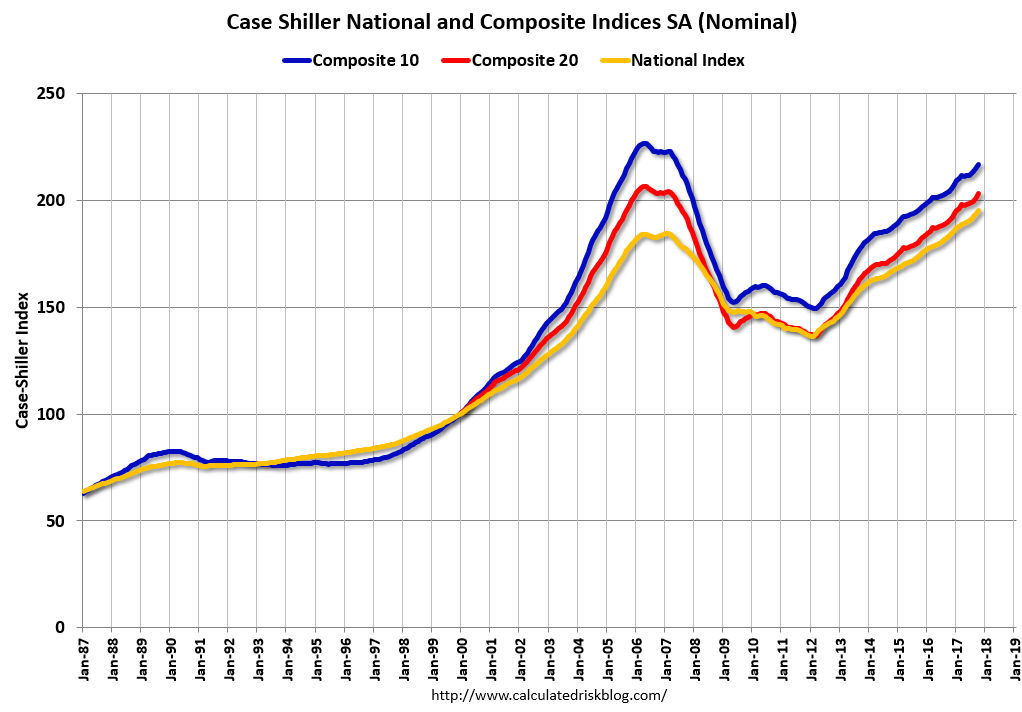
9:00 AM ET: S&P/Case-Shiller House Price Index for November (note: Some sites show this released on Wednesday during the Holidays)
This graph shows the nominal seasonally adjusted National Index, Composite 10 and Composite 20 indexes through the October 2017 report (the Composite 20 was started in January 2000).
The consensus is for a 6.4% year-over-year increase in the Comp 20 index for November.
10:00 AM: the Q4 Housing Vacancies and Homeownership from the Census Bureau.
----- Wednesday, Jan 31st -----
7:00 AM ET: The Mortgage Bankers Association (MBA) will release the results for the mortgage purchase applications index.
8:15 AM: The ADP Employment Report for January. This report is for private payrolls only (no government). The consensus is for 195,000 payroll jobs added in January, down from 250,000 added in December.
9:45 AM: Chicago Purchasing Managers Index for January. The consensus is for a reading of 64.0, down from 67.6 in December.
10:00 AM: Pending Home Sales Index for December. The consensus is for a 0.4% increase in the index.
2:00 PM: FOMC Meeting Announcement. The FOMC is expected to announce no change to policy at this meeting.
----- Thursday, Feb 1st -----
8:30 AM ET: The initial weekly unemployment claims report will be released. The consensus is for 235 thousand initial claims, up from 233 thousand the previous week.
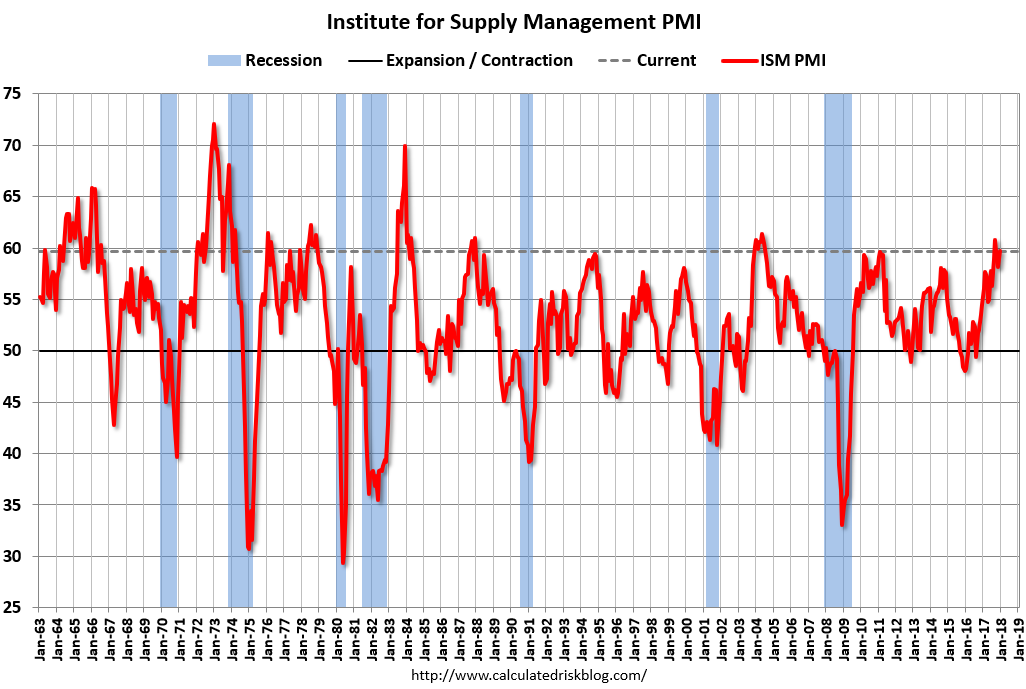
10:00 AM: ISM Manufacturing Index for January. The consensus is for the ISM to be at 58.7, down from 59.7 in December.
Here is a long term graph of the ISM manufacturing index.
The ISM manufacturing index indicated expansion in December. The PMI was at 59.7% in December, the employment index was at 57.0%, and the new orders index was at 69.4%.
10:00 AM: Construction Spending for December. The consensus is for a 0.5% increase in construction spending.
All day: Light vehicle sales for January. The consensus is for light vehicle sales to be 17.3 million SAAR in January, down from 17.8 million in December (Seasonally Adjusted Annual Rate).
This graph shows light vehicle sales since the BEA started keeping data in 1967. The dashed line is the December sales rate.
----- Friday, Feb 2nd -----
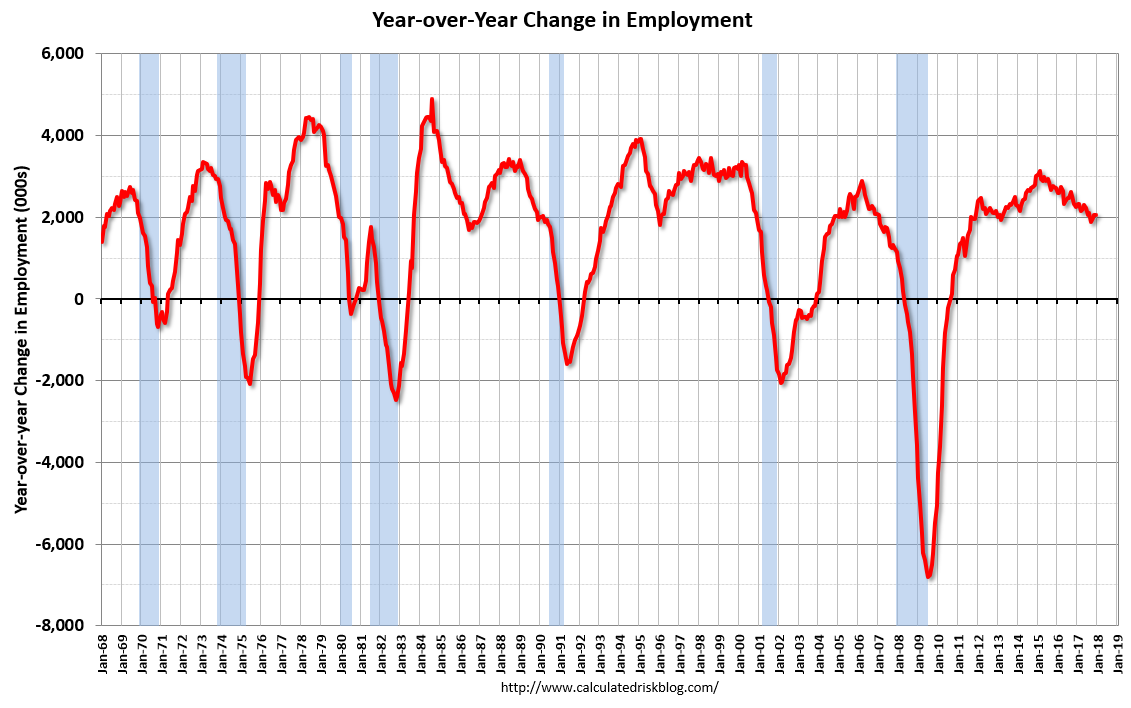
8:30 AM: Employment Report for January. The consensus is for an increase of 176,000 non-farm payroll jobs added in January, up from the 148,000 non-farm payroll jobs added in December.
The consensus is for the unemployment rate to be unchanged at 4.1%.
This graph shows the year-over-year change in total non-farm employment since 1968.
In December the year-over-year change was 2.055 million jobs.
A key will be the change in wages.
Note from the BLS: "Effective with the release of The Employment Situation for January 2018 on February 2, 2018, the establishment survey will introduce revisions to nonfarm payroll employment, hours, and earnings data to reflect the annual benchmark adjustment for March 2017 and updated seasonal adjustment factors. Not seasonally adjusted data beginning with April 2016 and seasonally adjusted data beginning with January 2013 are subject to revision. Consistent with standard practice, some historical data may be subject to revisions resulting from issues identified during the benchmark process." The preliminary benchmark revision showed an increase of 95,000 jobs.
10:00 AM: University of Michigan's Consumer sentiment index (preliminary for February). The consensus is for a reading of 95.0, up from 94.4 in January.
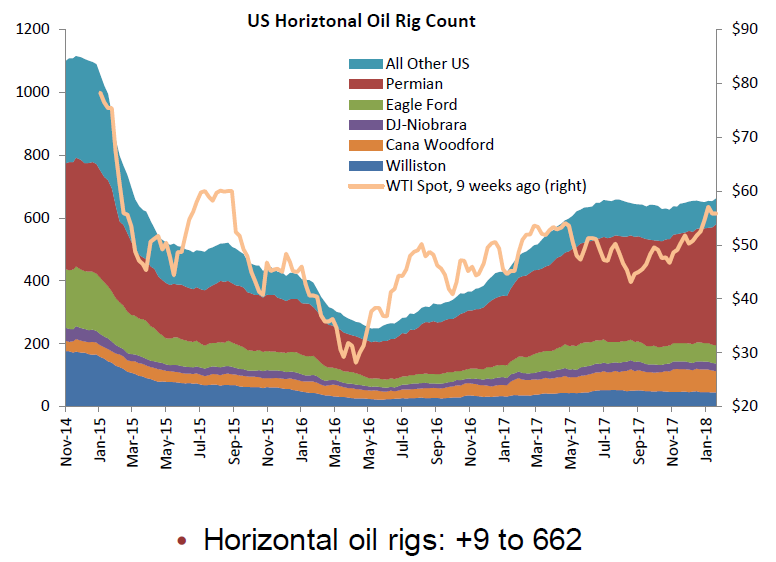
A few comments from Steven Kopits of Princeton Energy Advisors LLC on Jan 26, 2017:
• Total US oil rigs were up sharply, +12 to 759
• Horizontal oil rigs were similarly up, +9 to 662
• All of the gain comes from the Permian, up 18 rigs in total ... • The oil price continues to rise, with WTI above $66, even as the Brent spread has fallen below $5.
Click on graph for larger image.
CR note: This graph shows the US horizontal rig count by basin.
The Federal Reserve Bank of Philadelphia has released the coincident indexes for the 50 states for December 2017. Over the past three months, the indexes increased in 42 states and decreased in eight, for a three-month diffusion index of 68. In the past month, the indexes increased in 37 states, decreased in 10, and remained stable in three, for a one-month diffusion index of 54. emphasis added
Note: These are coincident indexes constructed from state employment data. An explanation from the Philly Fed:
The coincident indexes combine four state-level indicators to summarize current economic conditions in a single statistic. The four state-level variables in each coincident index are nonfarm payroll employment, average hours worked in manufacturing by production workers, the unemployment rate, and wage and salary disbursements deflated by the consumer price index (U.S. city average). The trend for each state’s index is set to the trend of its gross domestic product (GDP), so long-term growth in the state’s index matches long-term growth in its GDP.
Click on map for larger image.
Here is a map of the three month change in the Philly Fed state coincident indicators. This map was all red during the worst of the recession, and all or mostly green during most of the recent expansion.
Recently several states have turned red.
Source: Philly Fed.
Note: For complaints about red / green issues, please contact the Philly Fed.
And here is a graph is of the number of states with one month increasing activity according to the Philly Fed. This graph includes states with minor increases (the Philly Fed lists as unchanged).
In December, 38 states had increasing activity (including minor increases).
The downturn in 2015 and 2016, in the number of states increasing, was mostly related to the decline in oil prices.
The reason for the mid-to-late 2017 sharp decrease in the number of states with increasing activity is unclear.